Int J Drug Res Clin. 2:e13.
doi: 10.34172/ijdrc.2024.e13
Original Article
Computational Intelligent Modeling for Evaluating Metal Oxide Nanomaterial Cytotoxicity Against Escherichia coli
Senobar Naderian 1  , Taha Samad-Soltani 2, *
Author information:
1Student Research Committee, Tabriz University of Medical Sciences, Tabriz, Iran
2Department of Health Information Technology, School of Management and Medical Informatics, Tabriz University of Medical Sciences, Tabriz, Iran
Abstract
Background:
Metal oxide nanoparticles (MeOxNPs) possess unique physicochemical properties that differentiate them from bulk-sized forms, making them highly versatile for scientific, medical, chemical, and industrial applications. However, their small size and large surface area contribute to considerable chemical reactivity and underlying toxicity, necessitating comprehensive cytotoxicity evaluations. Previous studies have empirically assessed the toxicity of 17 metal oxides, while mathematical modeling has been proposed to establish a relationship between nanoparticle properties and toxicity.
Methods:
In this study, we introduced a computational modeling approach to predict the cytotoxicity of metal oxide nanomaterials against Escherichia coli as a model organism. A dataset comprising 17 MeOxNPs and their respective cytotoxicity values was collected from the literature and used to train the models. Molecular descriptors, including cation charge, electronegativity, molecular weight, and other factors, were employed to encode cytotoxicity. The models were evaluated using 10-fold cross-validation. Feature selection using the Relief algorithm was performed to identify the most important features for predicting toxicity. Linear regression was then applied as the predictive model.
Results:
The performance of the models was assessed based on their accuracy in predicting the cytotoxicity of metal oxide nanomaterials. The proposed models demonstrated high prediction capability. Then, we ranked the top 20 features in descending order of importance.
Conclusion:
The results indicated that the developed models provide a reliable mathematical framework for predicting the cytotoxicity of metal oxide nanomaterials to E. coli. This provides valuable insights for researchers in the field and supports the design of safer nanomaterials.
Keywords: Machine learning, Cytotoxicity, Metal oxide nanoparticles, Modeling, Random forest, Multiple linear regression, Artificial intelligence
Copyright and License Information
© 2024 The Author(s).
This is an open access article distributed under the terms of the Creative Commons Attribution License (
http://creativecommons.org/licenses/by/4.0/), which permits unrestricted use, distribution, and reproduction in any medium, provided the original work is properly cited.
Funding Statement
Not applicable.
Please cite this article as follows: Naderian S, Samad-Soltani T. Computational intelligent modeling for evaluating metal oxide nanomaterial cytotoxicity against Escherichia coli. Int J Drug Res Clin. 2024; 2: e13. doi: 10.34172/ijdrc.2024.e13
Introduction
Metal oxide nanoparticles (MeOxNPs) exhibit unique physicochemical properties that make them significantly different from bulk-sized forms.1,2 These properties are mainly related to the particle’s size, shape, and structure which can be used in a wide range of scientific, medical, chemical, and industrial applications.3 In environmental and toxicity studies, the small size and large surface area of MeOxNPs result in elevated chemical reactivity and intrinsic toxicity. To date, most cytotoxicity studies have focused on 17 metal oxides (i.e., ZnO, CuO, V2O3, Y2O3, Bi2O3, In2O3, Sb2O3, Al2O3, Fe2O3, SiO2, ZrO2, SnO2, TiO2, CoO, NiO, Cr2O3, and La2O3) and empirically evaluated their toxicity.4 To reduce the number of experiments, different researchers have proposed mathematical modeling to find a relationship between nanoparticle properties and toxicity and to identify the mechanism of nanoparticle toxicity. For example, Hu et al determined the toxicity of these nanoparticles toward Escherichia coli in terms of LD50 (i.e., the dosage of nanoparticles that leads to the death of 50% of cells) and correlated the data using multiple linear regression (MLR) method5. Venigalla et al measured the cytotoxicity of the same group of MeOxNPs in terms of log 1/EC50 or pEC50 (the effective concentration that reduces bacterial viability by 50%) and computed data using MLR, considering some definite descriptors for each nanoparticle.6 Additionally, other researchers reported the cytotoxicity–structure relationship for the same dataset using stepwise-MLR7, MLR combined with Pearson and pairwise correlations,8 random forest methods,9 multi-target QSTR models,10 random splits QSTR models,11,12 decision tree forest and decision tree boost models,13 counter propagation artificial neural networks,14 and other nano-QSAR models.15-18
Fields et al investigated the design and testing of new antimicrobial peptides (AMPs) with potential therapeutic functions against bacteria, especially Gram-negative species. Using computational design and in vitro validation, the designed peptides showed more sophisticated antibacterial activity against gram-negative bacteria, offering promising candidates for future therapeutic uses, despite some observed cytotoxicity that requires further evaluation.19 Roy and colleagues; study highlighted the exponential growth in producing MeOxNPs and the need for risk assessment due to potential environmental and health effects. They recommended in silico models using MLR to predict the cytotoxicity of MeOxNPs on E. coli cells and detected key factors affecting toxicity.20 Kar et al experimentally evaluated the cytotoxicity of eight Metal Oxide Nanoparticles (MONPs) on E. coli, ranking their toxicity using machine learning models.21
Despite the advantages and disadvantages of each method, developing a new model with high predictive capability remains a challenge for researchers. The current study aimed to offer a numerical model for predicting the cytotoxicity of MeOxNPs to E. coli as a model cell. The toxicity of some commonly used MeOxNPs was collected from the literature and used to train the investigated models. The models were proposed based on molecular descriptors derived from chemical structure, atom compositions, and features related to their manufacture. To analyze the predictive capability of the mentioned models, we applied 10-fold cross-validation.
Materials and Methods
Data Set and Descriptors for In Silico Modeling
Initially, 20 descriptors were considered to model the cytotoxicity of nanoparticles. However, only a portion of the descriptor set was eventually used in the model construction process due to data availability constraints and model complexity. We specifically chose three descriptors for the dataset of 15 data points based on their availability in the dataset and their applicability to the cytotoxicity prediction task. Although this method reduced the model’s overall comprehensiveness, it allowed us to focus on the most useful descriptors for predicting nanoparticle toxicity within the limits of our dataset.
An overview of the research life cycle is presented in Figure 1. The dataset consisted of 17 MeOxNPs, namely, ZnO, CuO, V2O3, Y2O3, Bi2O3, In2O3, Sb2O3, Al2O3, Fe2O3, SiO2, ZrO2, SnO2, TiO2, CoO, NiO, Cr2O3, and La2O3, with cytotoxicity expressed in terms of pE50 and pLC50 (mol.L-1). The first dataset was taken from Mu and colleagues’ work8 and the second from Kuz’min and colleagues’.22 All toxicity data were converted into a negative logarithmic scale for modeling purposes.
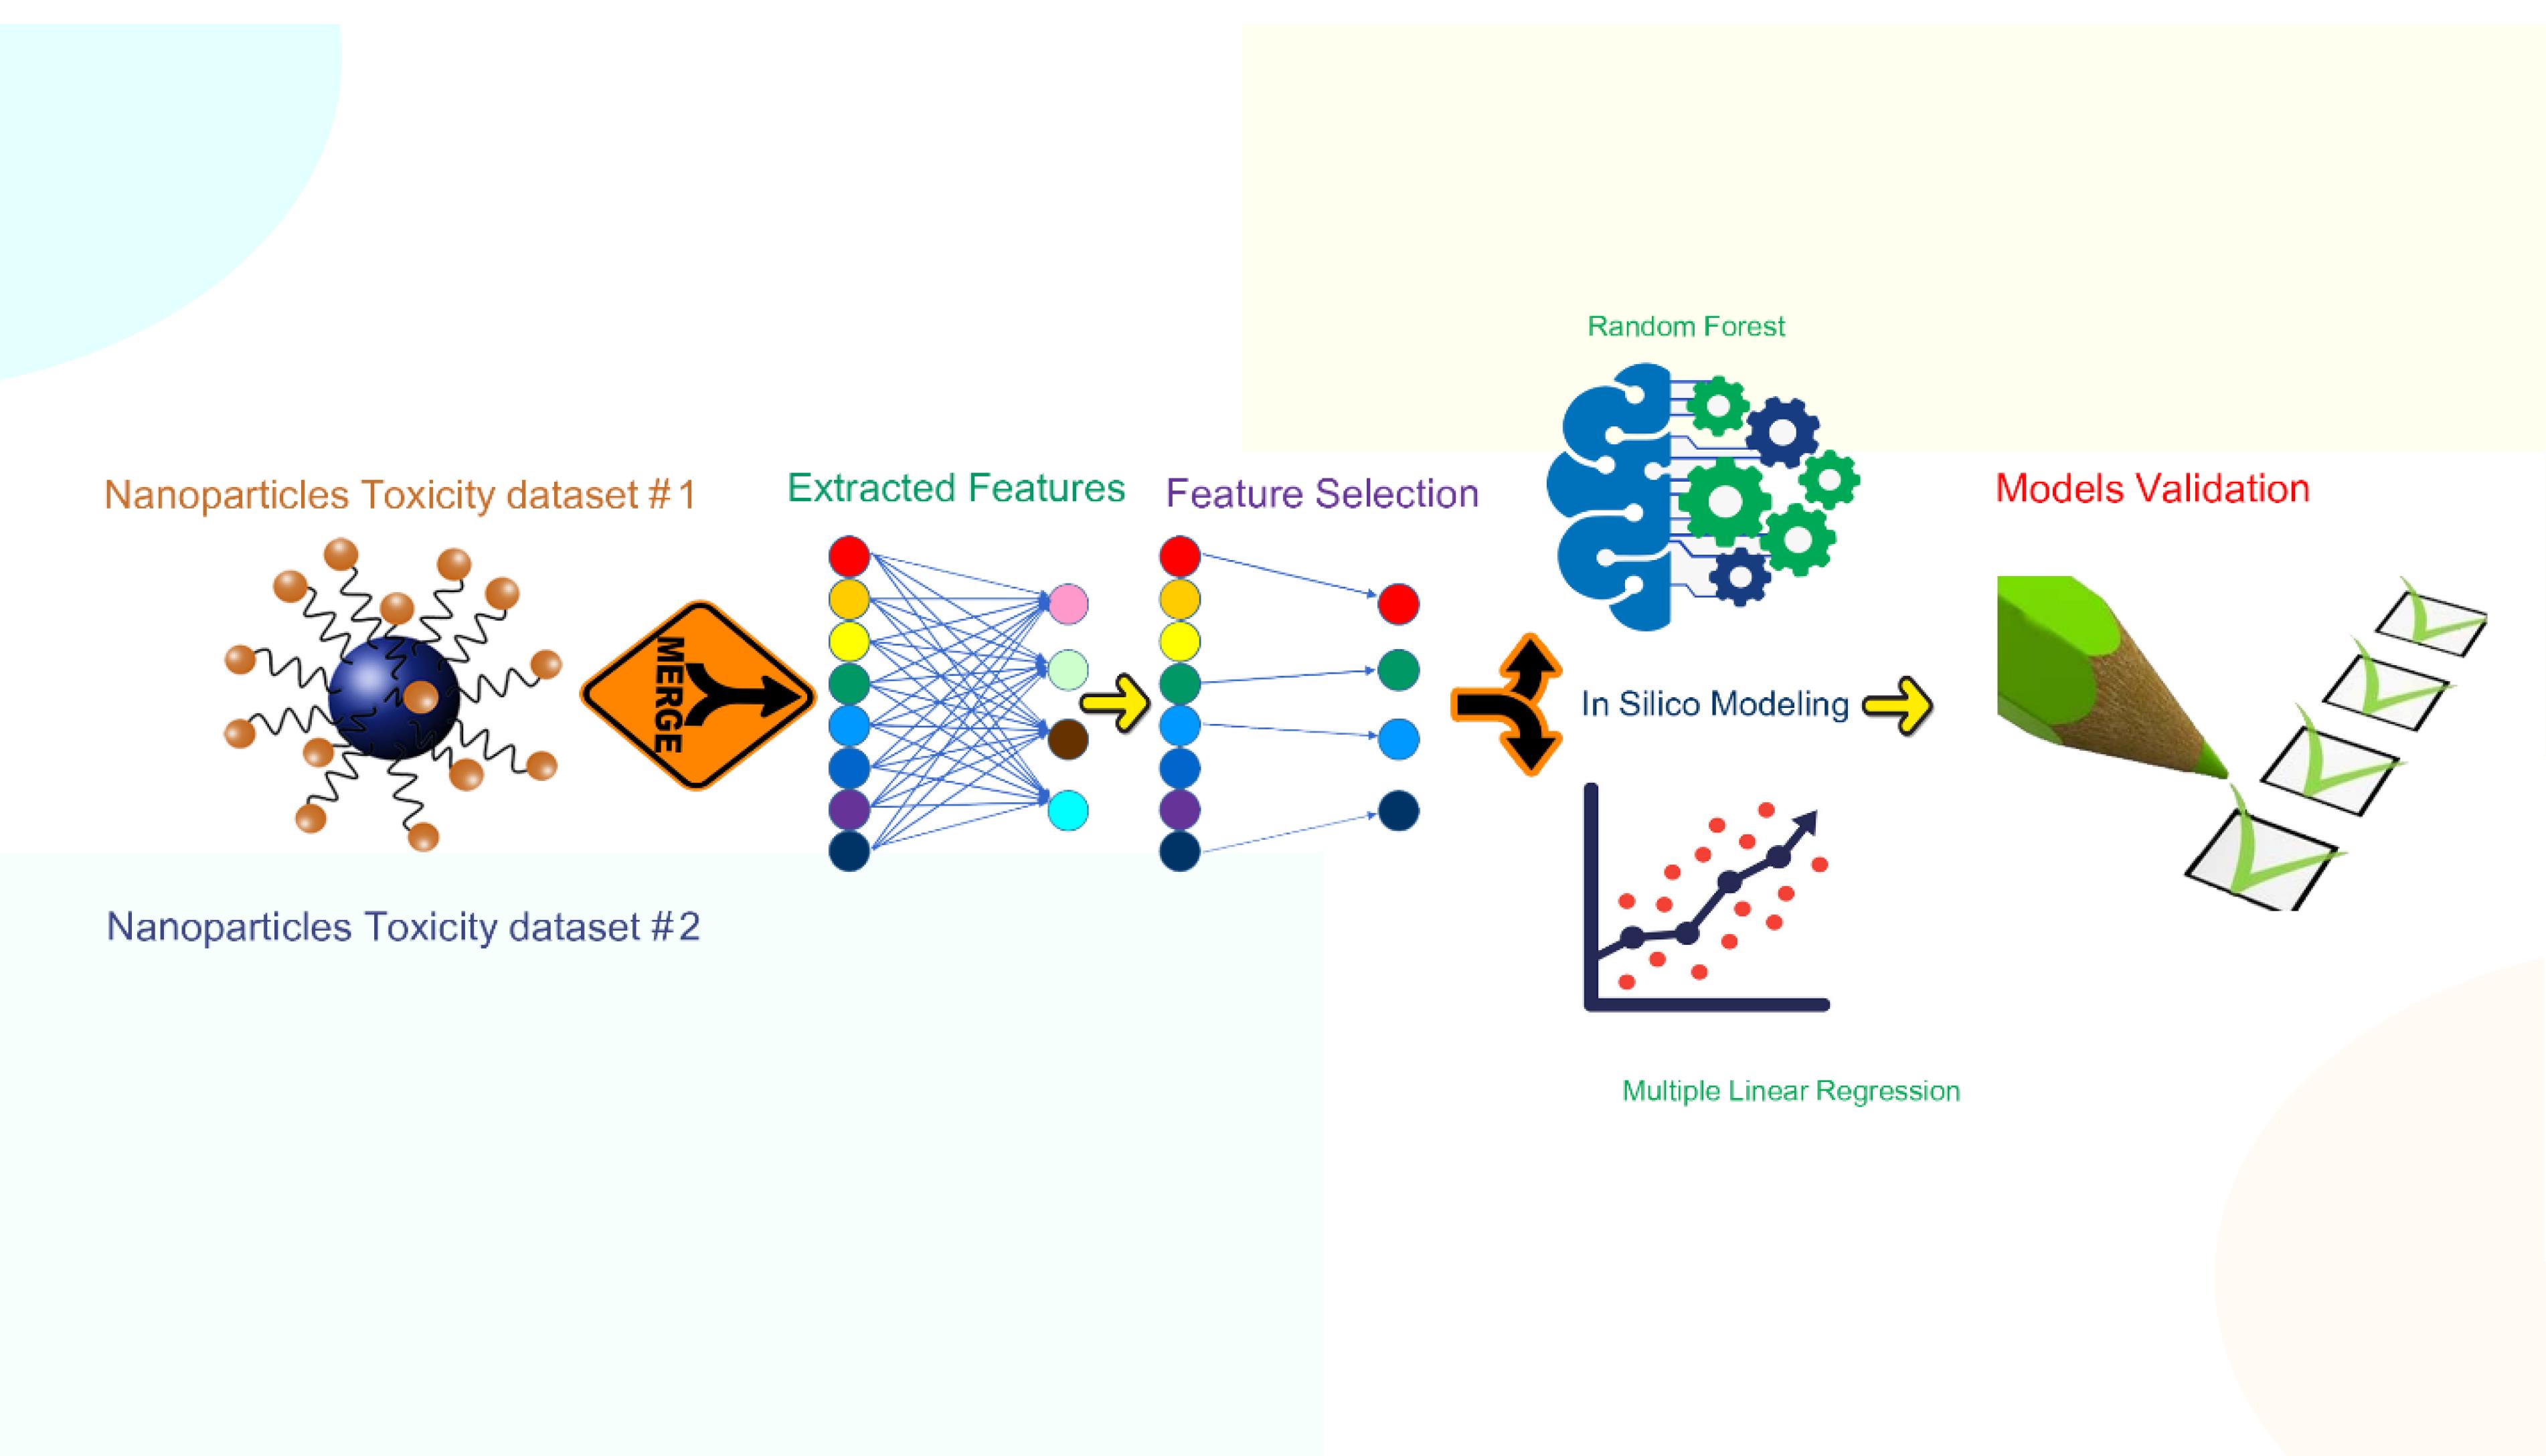
Figure 1.
Research Life Cycle Including Computational Methodology Created by the Authors Using Free Vectors
.
Research Life Cycle Including Computational Methodology Created by the Authors Using Free Vectors
A total pool of 20 descriptors was used for modeling. Descriptors taken from the literature were obtained either from experiments or calculations using density functional theory. These elementary descriptors of metal oxides to encrypt cytotoxicity include cation charge, hardness, electrophilicity index, electronegativity (χ), total metal electronegativity for each metal oxide divided by the number of oxygen atoms in each metal oxide (∑χ = nO), total metal atoms (NMetal), total oxygen atoms (NOxygen), molecular weight (MW), the energy gaps of frontier molecular orbital (∆E), the average of α-LUMO and β-LUMO (aveLUMO), molar heat capacity, enthalpy of formation of a gaseous cation (∆Hme+), atomic number (AN), Pauling ionic radius (r), the difference between IP (N + 1) and IP (∆IP), electrochemical potential (∆E°), first hydrolysis constants (|logK OH|), covalent index (
), similar polarization force parameters (Z/AR2), and standard heat of formation of the oxide cluster (HoF). A list of the used features and cytotoxicity data (log(EC50)-1) is reported in Table 1.
Table 1.
List of Descriptors and Cytotoxicity Values Used for Model Development
|
Metal Oxide
|
ZnO
|
CuO
|
V2O3
|
Y2O3
|
Bi2O3
|
In2O3
|
Sb2O3
|
Al2O3
|
Fe2O3
|
SiO2
|
ZrO2
|
SnO2
|
TiO2
|
CoO
|
NiO
|
Cr2O3
|
La2O3
|
|
Cation Charge
|
2 + |
2 + |
3 + |
3 + |
3 + |
3 + |
3 + |
3 + |
3 + |
4 + |
4 + |
4 + |
4 + |
2 + |
2 + |
3 + |
3 + |
|
Hardness
|
0.1576 |
0.1632 |
0.1792 |
0.1474 |
0.1058 |
0.2047 |
0.20 of safer metal oxide nanoparticles |
0.2033 |
0.0424 |
0.2496 |
0.1611 |
0.2205 |
0.1819 |
0.1613 |
0.1527 |
0.1365 |
0.1165 |
|
Electrophilicity Index
|
0.0973 |
0.0485 |
0.0942 |
0.1032 |
0.0496 |
0.1005 |
0.0344 |
0.1203 |
0.358 |
0.1259 |
0.1017 |
0.0747 |
0.1027 |
0.0815 |
0.095 |
0.1063 |
0.0521 |
|
χ
|
1.65 |
1.9 |
1.63 |
1.22 |
2.02 |
1.78 |
2.05 |
1.61 |
1.83 |
1.9 |
1.33 |
1.96 |
1.54 |
1.88 |
1.91 |
1.66 |
1.1 |
|
∑χ=nO
|
1.65 |
1.9 |
1.087 |
0.813 |
1.347 |
1.187 |
1.367 |
1.073 |
1.22 |
0.95 |
0.665 |
0.98 |
0.77 |
1.88 |
1.91 |
1.107 |
0.733 |
|
MW
|
81.38 |
79.546 |
149.88 |
225.82 |
465.96 |
277.62 |
291.52 |
101.96 |
159.6 |
60.08 |
123.2 |
150.7 |
79.86 |
74.93 |
74.69 |
151.98 |
325.8 |
|
NMetal
|
1 |
1 |
2 |
2 |
2 |
2 |
2 |
2 |
2 |
1 |
1 |
1 |
1 |
1 |
1 |
2 |
2 |
|
NOxygen
|
1 |
1 |
3 |
3 |
3 |
3 |
3 |
3 |
3 |
2 |
2 |
2 |
2 |
1 |
1 |
3 |
3 |
|
aveLUMO
|
-0.087 |
-0.12 |
-0.117 |
-0.068 |
-0.116 |
-0.127 |
-0.086 |
-0.138 |
-0.114 |
-0.147 |
-0.125 |
-0.143 |
-0.125 |
-0.123 |
-0.117 |
-0.135 |
-0.054 |
|
ΔE
|
0.132 |
0.178 |
0.174 |
0.129 |
0.184 |
0.196 |
0.174 |
0.211 |
0.175 |
0.245 |
0.184 |
0.224 |
0.195 |
0.169 |
0.18 |
0.199 |
0.121 |
|
Molar Heat Capacity
|
40.25 |
42.3 |
103.22 |
102.51 |
113.51 |
92 |
101.63 |
79.04 |
103.85 |
44.43 |
56.19 |
52.59 |
55.48 |
55.23 |
44.31 |
118.74 |
108.74 |
|
ΔHme+
|
662.44 |
706.25 |
1097.93 |
837.15 |
1137.4 |
1271.13 |
1233.06 |
1187.83 |
1408.29 |
- |
1357.66 |
1717.32 |
1575.73 |
601.8 |
596.7 |
1268.7 |
1017.22 |
|
AN
|
30 |
29 |
23 |
39 |
83 |
49 |
51 |
13 |
26 |
- |
40 |
50 |
22 |
27 |
28 |
24 |
57 |
|
r
|
0.74 |
0.73 |
0.64 |
0.9 |
1.03 |
0.8 |
0.76 |
0.54 |
0.55 |
- |
0.72 |
0.69 |
0.61 |
0.65 |
0.69 |
0.62 |
1.03 |
|
ΔIP
|
21.76 |
16.55 |
17.4 |
40.08 |
19.74 |
25.97 |
18.9 |
91.54 |
24.15 |
|
46.01 |
31.54 |
56.03 |
16.42 |
17.02 |
18.2 |
30.77 |
|
ΔE0
|
0.76 |
0.16 |
1 |
2.37 |
0.2 |
0.49 |
0.66 |
1.66 |
0.77 |
|
1.45 |
0.15 |
0.5 |
0.28 |
0.23 |
0.41 |
2.37 |
|
|logKOH|
|
8.2 |
8 |
2.26 |
7.7 |
1.09 |
4 |
2.72 |
4.3 |
2.2 |
|
0.3 |
3.4 |
2.2 |
9.7 |
9.9 |
4 |
8.5 |
|
Xm2r
|
2.01 |
2.64 |
1.7 |
1.34 |
4.2 |
2.53 |
3.19 |
1.4 |
1.84 |
|
1.27 |
2.65 |
1.45 |
2.3 |
2.52 |
1.71 |
1.25 |
|
Z/AR2
|
0.85 |
0.81 |
1.75 |
0.95 |
1.41 |
1.14 |
1.28 |
0.91 |
1.01 |
|
1.58 |
2.04 |
1.9 |
0.72 |
0.76 |
0.88 |
0.4 |
|
HoF
|
-5307 |
-954.75 |
-3192 |
-11486 |
-1966 |
-3088 |
-2140 |
-8244 |
-1051 |
|
-9834 |
-2611 |
-9826 |
-8799 |
63.89 |
-2829 |
|
|
pEC50a
|
3.45 |
3.2 |
3.14 |
2.87 |
2.82 |
2.81 |
2.64 |
2.49 |
2.29 |
2.2 |
2.15 |
2.01 |
1.74 |
3.51 |
3.45 |
2.51 |
2.87 |
Note: χ: Electronegativity; ∑χ = nO: Total metal electronegativity for each distinct metal oxide divided by the total number of oxygen atoms in that specific metal oxide; NMetal: Number of metal atoms; NOxygen: Number of oxygen atoms; MW: Molecular weight; ∆E: Energy gaps of the frontier molecular orbital; aveLUMO: Average of α-LUMO and β-LUMO; ∆Hme + : Enthalpy of formation of a gaseous cation; AN: Atomic number; r: Pauling ionic radius; ∆IP: Difference between IP(N + 1) and IP; ∆E°: Electrochemical potential; |logK OH|: First hydrolysis constants; Xm2r: Covalent index; Z/AR2: Similar polarization force parameters; HoF: Standard heat of formation of the oxide cluster; a: Cytotoxicity data are taken from literature.8
Dataset Division and In Silico Modeling Tools
Since missed data affects the output of the predictor, this study used the averaging technique to handle missing data. In this technique, the mean value of a quantitative feature is applied in place of missing values for that same feature. The main advantage of this method is that it does not change the sample mean for that feature.
Feature Selection
To avoid overfitting and choose the most crucial elements for determining the level of toxicity, the Relief algorithm was applied because the variables are quantitative and not batch. The Relief algorithm, first developed by Kira and Rendell in 1992,20,21 is inspired by instance-based learning and can discover conditional interactions between features, providing a unified vision of the feature ranking in classification and regression.22,23
The Relief algorithm uses a filtering method to calculate a feature score for each feature, which can be applied to estimate the quality of features and select top-scoring features. These feature scores are referred to as feature weights. For feature “A”, W [A] is the weight of feature “A” that can range from the worst (-1) to the best (+1). In this study, we tested 5, 10, and 15 important features. It should be mentioned that log variable (log (1/EC50)33 was considered as the forecast target in the dataset.
Description of the Model
In this study, the linear regression technique was selected as the predictor model. Linear regression is a technique to model the relationship between variables in the dataset and the targets predicted by the linear approximation. The relationship is modeled using linear functions whose unknown parameters are estimated from the data.
A linear regression line has an equation in the form:
where y is the dependent variable, x is the independent variable, β is the slope of the line, and α is the intercept (the value of y when x = 0).
For a given observe n data pairs {(xi, yi), i = 1,..., n}, we can define the underlying relationship between yi and xi involving the error εi by:
The relationship between the data points and the true (but unobserved) underlying parameters α and β is called a linear regression model. εi is defined as follows:
The parameters α and β are given by:
(Eq. 4)
All methods in this study were implemented in the Orange 3 version.
Model Validation
Ten-fold cross-validation was employed in our study to evaluate the model’s efficacy. Validation of the model is an important factor that must be carefully taken into account. We acknowledge that additional validation methods or studies are required to ensure the model’s dependability as the validation approach may not have been sufficiently comprehensive. Future research should attempt to solve this weakness by utilizing additional validation procedures such as bootstrapping methodologies or external validation with independent datasets. The entire dataset is randomly split into ten folds during this process, with four folds used for training and one for testing. Ten iterations of this technique were run, with a single test conducted on each instance. The mean squared error (MSE), root mean square error (RMSE), mean absolute error (MAE), and coefficient of determination (R2) were calculated as follows to assess the predictor performance:
(Eq. 5)
where n is the number of data points, Yi is observed values, and Yi is predicted values.
(Eq. 6)
where i is the variable, N is the number of non-missing data points, xi is the actual observations time series, and xi is the estimated time series.
where, yi is the prediction, xi is the true value, and n is the total number of data points.
where RSS is the sum of squares of residuals, and TSS is the total sum of squares.
Details of the QSAR Model Based on Linear Regression
We used linear regression to create a quantitative structure-activity relationship (QSAR) model to further clarify our model’s predictive power. A dataset containing 17 different MONPs and their associated cytotoxicity against E. coli was used to build the QSAR model. To ensure consistency and compatibility for modeling, the dataset was preprocessed to transform cytotoxicity data into negative logarithmic scales before the model was developed.
The Relief algorithm was used for feature selection and model optimization, which is a reliable technique for finding pertinent features while reducing the chance of overfitting. The relief method facilitated the prioritization of features according to their importance in predicting the cytotoxicity of nanoparticles. Due to its interpretability and simplicity, linear regression was used as the predictor model to model the association between physicochemical characteristics and cytotoxicity.
A popular method for evaluating model performance, 10-fold cross-validation, was used to train and validate the linear regression model. The dataset was randomly divided into ten folds for cross-validation, with each iteration using one fold for testing and four folds for training. The predictive accuracy of the model was assessed using performance metrics such as R2, MAE, MSE, and RMSE.
Results
The Optimal Descriptors for In Silico Modeling
Twenty descriptors used for model training are obtained from information in the literature. These descriptors show the physicochemical properties of each nanoparticle at the molecular scale, free metal ions, surface, and valence, demonstrating ionization and dissolution potentials of metal ions that can be used in the development of a mathematical model. After an initial assessment, the Relief method was employed to help select some optimal parameters. These parameters are cation charge, Nmetal, Noxygen, ∑χ = No, and ΔHme+, which have the most significant effect (negative or positive) on cytotoxicity value. Thus, these features were selected as the main inputs for mathematical modeling.
The first significant descriptor based on the feature selection method is the cation charge of employed MONPs, making up approximately 0.771 confidence which implies its most important role in the toxicity of nanoparticles. The cytotoxicity decreased with the increase in the cation charge in the following order: Me2+ > Me3+ > Me4+. Nmetal and Noxygen are constitutional descriptors, representing the elemental composition of the molecule. These three mentioned parameters are somehow interdependent. A low cation charge is caused by a low oxygen percentage in the molecular structure and a high metal percentage demonstrating the low cation charge and subsequently low oxygen percentage.
Another parameter, ∑χ = nO, demonstrates the sum of metal electronegativity for individual metal oxide divided by the number of oxygen atoms present in a particular metal oxide. The feature of ΔHme+ or molar enthalpy of the formation of gaseous ions is another important parameter in cytotoxicity. Ion release from nanoparticles is a crucial factor in the toxicity induction of nanoparticles. The lesser charge cations are more energetically favorable than those with high electrons to lose. For example, MONP of Bi2O3 is more toxic than BiO2. The release of ions is also along with the reactive oxygen species production such as hydroxyl and superoxide radicals.
Linear Regression Performances
To test and select the appropriate model for our problem, we tested two different algorithms: random forest and linear regression. Five of the most important features were applied as features that have been already mentioned. To set the random forest algorithm, the number of trees was set to 7 according to test different experiments, and subsets lower than two trees were prevented. Linear regression was implemented with elastic net regression, which linearly combines the penalties of the ridge and lasso techniques.
We performed a 10-fold cross-validation strategy to evaluate the results of the test and training set. The average performance results are indicated in Table 2, which shows the power of predictors calculated based on four metrics, including the prediction metrics such as MSE, RMSE, MAE, and R2.
Table 2.
The Average Performances of Our Model With Random Forest Algorithm on Dataset
|
Model
|
MSE
|
RMSE
|
MAE
|
R2
|
| Random Forest |
0.044 |
0.209 |
0.178 |
0.835 |
| Linear |Regression |
0.043 |
0.208 |
0.174 |
0.837 |
Note. MSE: Mean squared error; RMSE: Root mean square error; MAE: Mean absolute error; R2: Coefficient of determination.
Since R2 and RMSE values must be close to 1 and 0, respectively, it is evident from Table 2 that linear regression provides better values for five different features. The linear regression had superior outcomes compared to the random forest algorithm. In this study, toxicity prediction was similar to value prediction, which can justify that linear regression had higher performance. Eventually, since linear regression achieves better performance for our benchmark dataset, we selected linear regression as our model.
Results of Feature Selection
Since linear regression had a notable performance in nano chemical predictions, linear regression was selected as our predictor model, and all parameters of our model were set to default values. In this study, the optimal number of features was set to five by several experiments on Relief parameters and different numbers of features. It should be mentioned that the log variable 1 / EC50 was considered as a forecast target in the data set (See Table 3).
Table 3.
Ranking 20 Features Using Feature Selection Method
|
#
|
Features
|
Features’ Ranking
|
| 1 |
Cation Charge |
0.737 |
| 2 |
Nmetal |
0.528 |
| 3 |
NOxygen |
0.491 |
| 4 |
Molar Heat Capacity |
0.404 |
| 5 |
∑χ = nO |
0.395 |
| 6 |
|logKOH| |
0.381 |
| 7 |
ΔHme+ |
0.370 |
| 8 |
ΔE0 |
0.311 |
| 9 |
Z/AR2 |
0.303 |
| 10 |
HoF |
0.299 |
| 11 |
ΔE |
0.293 |
| 12 |
aveLUMO |
0.291 |
| 13 |
r |
0.286 |
| 14 |
x |
0.285 |
| 15 |
MW |
0.259 |
| 16 |
Hardness |
0.229 |
| 17 |
Xm2r |
0.228 |
| 18 |
ΔIP |
0.222 |
| 19 |
AN |
0.213 |
| 20 |
Electrophilicity Index |
0.159 |
Note: χ: Electronegativity; ∑χ = nO: Total metal electronegativity for each distinct metal oxide divided by the total number of oxygen atoms in that specific metal oxide; NMetal: Number of metal atoms; NOxygen: Number of oxygen atoms; MW: Molecular weight; ∆E: Energy gaps of the frontier molecular orbital; aveLUMO: Average of α-LUMO and β-LUMO; ∆Hme + : Enthalpy of formation of a gaseous cation; AN: Atomic number; r: Pauling ionic radius; ∆IP: Difference between IP(N + 1) and IP; ∆E°: Electrochemical potential; |logK OH|: First hydrolysis constants; X m2r: Covalent index; Z/AR2: Similar polarization force parameters; HoF: Standard heat of formation of the oxide cluster.
Discussion
General Discussion
This study aimed to identify key descriptors for in silico modeling of nanoparticle cytotoxicity and develop mathematical models to predict toxicity accurately. Using an initial assessment and the Relief method analysis, we identified five optimal descriptors: cation charge, Nmetal, Noxygen, ∑χ = nO, and ΔHme + 5. These descriptors, obtained from literature, represent the physicochemical properties of nanoparticles at the molecular scale, including ionization and dissolution potentials of metal ions.
The significance of cation charge emerged prominently, with a reported negative correlation with cytotoxicity.5 Our findings are consistent with previous research that indicates a decrease in cytotoxicity with increasing cation charge. Furthermore, lower valent cations exhibited higher cytotoxicity due to their stronger attraction to E. coli microorganisms.5 Moreover, Nmetal and Noxygen, representing elemental composition, were found to be interdependent with cation charge, influencing cytotoxicity through variations in oxygen content.5
Additionally, ∑χ = nO, indicative of metal electronegativity per oxygen atom, provided insights into the toxic effects of metal nanoparticles with different metal or oxygen atom ratios.8 This parameter helped visualize the impact of metal nanoparticles on E. coli, considering their various compositions.8
The feature of ΔHme + or molar enthalpy of formation of gaseous ions emerged as another crucial parameter in cytotoxicity assessment.24 Ion release from nanoparticles, influenced by ΔHme + , was identified as a key factor in nanoparticle toxicity induction.25 This aligns with recent insights into the acute toxic/genotoxic effects of specific nanoparticles such as CuO and ZnO demonstrated in in vivo models.25,26 Studies have demonstrated that toxicity to macrophages can stem from the cellular uptake and intracellular release of metal ions, underscoring the role of nanoparticles and their ions in toxicity induction.26,27 Additionally, investigations into the toxicity of nanosized and bulk metal oxides to various organisms, including bacteria and crustaceans, have highlighted the importance of chemical stability in determining cellular toxicity.28-30 Our results indicated that nanoparticles with lesser charge cations are more energetically favorable and exhibit higher toxicity upon exposure.24 The selected optimal descriptors were utilized to develop mathematical models, with linear regression outperforming the random forest algorithm in predicting cytotoxicity.31-35 This superiority of linear regression, supported by its efficiency in toxicity prediction problems, underscores its utility in nanoparticle toxicity assessment.31-35 Furthermore, findings from other studies corroborate our results, with linear discriminant analysis performing well in understanding the toxicity mechanisms of MONPs.21 This suggests the robustness of our approach in identifying key descriptors for cytotoxicity prediction.21 The results of feature selection revealed the importance of cation charge, elemental composition, metal electronegativity, and molar enthalpy of formation of gaseous ions in nanoparticle cytotoxicity assessment.22,36,37 Linear regression, coupled with the Relief technique for ranking features, provided valuable insights into the mode of toxic action, facilitating the design of safer MONPs.22,38-41 Moreover, the superior ability of linear regression in achieving values for prediction metrics such as MSE, RMSE, MAE, and R2is consistent with previous studies by Babayevska et al42 and Zheng et al,43 which demonstrated the efficacy of linear regression in modeling nanoparticle toxicity based on physicochemical properties.
Role of Computational Intelligence in Clinical Nanotoxicology
According to Massoumi et al,44 integrating computational intelligence into clinical practice holds significant promise for addressing nanoparticle safety concerns and optimizing their biomedical applications. By leveraging predictive modeling and machine learning algorithms, clinicians can assess the cytotoxicity of nanoparticles more accurately and evaluate health risks associated with nanoparticle exposure. Additionally, Fathy Abo-Elmahasen et al demonstrated the application of computational modeling in evaluating the microbiological activities and cytotoxicity profiles of nano coatings for orthodontic mini-screws, highlighting their potential for mitigating inflammatory responses and improving device performance.45 Furthermore, Babayevska et al emphasized the importance of understanding structure-activity relationships for safer nanoparticle design, which can be facilitated through computational modeling techniques.42 These studies collectively underscore the role of computational intelligence in enhancing clinical decision-making, risk assessment, and the design of safer nanomaterials for various biomedical applications.
Mechanistic Interpretation of the Model
Elucidating the mechanistic insights underlying our model is vital for enhancing its interpretability and practical utility. As emphasized by Toropova and Toropov,46 understanding the mechanistic basis of predictive models is crucial for advancing their application in various domains, including drug discovery and design. In light of this, we aimed to delve deeper into the mechanistic interpretation of our model, drawing inspiration from Toropova and Toropov’s work,46 which proposed a Monte Carlo method for predicting endpoints in medicinal chemistry. By incorporating mechanistic insights from molecular dynamics simulations, as demonstrated by Siani et al47 in their study on targeted photodynamic therapy, we endeavored to unravel the intricate interplay between nanoparticle properties and cellular responses underlying cytotoxicity. Furthermore, leveraging advanced analytical techniques such as those employed by Bicherel and Thomas48 in their investigation of the aquatic toxicity of mixtures can provide valuable mechanistic insights into nanoparticle-induced cytotoxicity. Through interdisciplinary collaboration and integration of experimental and computational approaches, we aimed to elucidate the underlying mechanisms of nanoparticle cytotoxicity comprehensively. This study will not only enhance our understanding of nanoparticle toxicity but also pave the way for the rational design of safer nanomaterials with reduced cytotoxicity.
Conclusion
In this study, an in silico model was presented for predicting the cytotoxicity of MONPs. This model tests the relationships among 20 physicochemical properties of 17 MONPs and their cytotoxic effects on E. coli as a model cell. The accuracy and predictive capability of the proposed numerical model are better compared to the previously developed ones due to a new comprehensive dataset that combines previous datasets and properties. The predictor was constructed using a linear regression algorithm, and optimal features were selected using the Relief technique. Our model exhibited high performance on our constructed benchmark dataset. The results indicated that our model could provide a roadmap for predicting the toxicity of nanoparticles in an all-pervading way.
Ethics statement
The data utilized in this study was obtained from literature review. No new data collection involving human participants or animals was conducted.
Conflict of interests declaration
The authors declare no conflict of interests.
Acknowledgments
We would like to express our deep gratitude to our colleagues in the nano discipline for their valuable contributions and support throughout this research endeavor.
Data availability statement
The data supporting for this study’s findings are available on request from the corresponding author following the reasonable request.
Author contributions
Conceptualization: Taha Samad-Soltani.
Data curation: Senobar Naderian.
Formal analysis: Senobar Naderian.
Funding acquisition: Taha Samad-Soltani.
Investigation: Senobar Naderian, Taha Samad-Soltani.
Methodology: Senobar Naderian, Taha Samad-Soltani.
Project adminstration: Taha Samad-Soltani.
Resources: Taha Samad-Soltani.
Software: Senobar Naderian.
Supervision: Taha Samad-Soltani.
Validation: Senobar Naderian, Taha Samad-Soltani.
Visualization: Taha Samad-Soltani.
Writing–original draft: Senobar Naderian.
Writing–review & editing: Taha Samad-Soltani.
Consent for publication
Not applicable.
References
- Horie M, Fujita K. Toxicity of metal oxides nanoparticles. In: Fishbein JC. Advances in Molecular Toxicology. Vol 5. Oxford: Elsevier; 2011. p. 145-78. 10.1016/b978-0-444-53864-2.00004-9.
- Schrand AM, Rahman MF, Hussain SM, Schlager JJ, Smith DA, Syed AF. Metal-based nanoparticles and their toxicity assessment. Wiley Interdiscip Rev Nanomed Nanobiotechnol 2010; 2(5):544-68. doi: 10.1002/wnan.103 [Crossref] [ Google Scholar]
- Chavali MS, Nikolova MP. Metal oxide nanoparticles and their applications in nanotechnology. SN Appl Sci 2019; 1(6):607. doi: 10.1007/s42452-019-0592-3 [Crossref] [ Google Scholar]
- Buglak AA, Zherdev AV, Dzantiev BB. Nano-QSAR for cytotoxicity prediction of engineered nanomaterials. Molecules 2019; 24(24):4537. doi: 10.3390/molecules24244537 [Crossref] [ Google Scholar]
- Hu X, Cook S, Wang P, Hwang HM. In vitro evaluation of cytotoxicity of engineered metal oxide nanoparticles. Sci Total Environ 2009; 407(8):3070-2. doi: 10.1016/j.scitotenv.2009.01.033 [Crossref] [ Google Scholar]
- Venigalla S, Dhail D, Ranjan P, Jain S, Chakraborty T. Computational study about cytotoxicity of metal oxide nanoparticles invoking nano-QSAR. New Front Chem 2013; 23(2):123-30. [ Google Scholar]
- Kar S, Gajewicz A, Roy K, Leszczynski J, Puzyn T. Extrapolating between toxicity endpoints of metal oxide nanoparticles: predicting toxicity to Escherichia coli and human keratinocyte cell line (HaCaT) with nano-QTTR. Ecotoxicol Environ Saf 2016; 126:238-44. doi: 10.1016/j.ecoenv.2015.12.033 [Crossref] [ Google Scholar]
- Mu Y, Wu F, Zhao Q, Ji R, Qie Y, Zhou Y. Predicting toxic potencies of metal oxide nanoparticles by means of nano-QSARs. Nanotoxicology 2016; 10(9):1207-14. doi: 10.1080/17435390.2016.1202352 [Crossref] [ Google Scholar]
- Sizochenko N, Rasulev B, Gajewicz A, Kuz’min V, Puzyn T, Leszczynski J. From basic physics to mechanisms of toxicity: the “liquid drop” approach applied to develop predictive classification models for toxicity of metal oxide nanoparticles. Nanoscale 2014; 6(22):13986-93. doi: 10.1039/c4nr03487b [Crossref] [ Google Scholar]
- Basant N, Gupta S. Multi-target QSTR modeling for simultaneous prediction of multiple toxicity endpoints of nano-metal oxides. Nanotoxicology 2017; 11(3):339-50. doi: 10.1080/17435390.2017.1302612 [Crossref] [ Google Scholar]
- Toropov AA, Toropova AP, Benfenati E, Gini G, Puzyn T, Leszczynska D. Novel application of the CORAL software to model cytotoxicity of metal oxide nanoparticles to bacteria Escherichia coli. Chemosphere 2012; 89(9):1098-102. doi: 10.1016/j.chemosphere.2012.05.077 [Crossref] [ Google Scholar]
- Kar S, Gajewicz A, Puzyn T, Roy K, Leszczynski J. Periodic table-based descriptors to encode cytotoxicity profile of metal oxide nanoparticles: a mechanistic QSTR approach. Ecotoxicol Environ Saf 2014; 107:162-9. doi: 10.1016/j.ecoenv.2014.05.026 [Crossref] [ Google Scholar]
- Singh KP, Gupta S. Nano-QSAR modeling for predicting biological activity of diverse nanomaterials. RSC Adv 2014; 4(26):13215-30. doi: 10.1039/c4ra01274g [Crossref] [ Google Scholar]
- Fjodorova N, Novic M, Gajewicz A, Rasulev B. The way to cover prediction for cytotoxicity for all existing nano-sized metal oxides by using neural network method. Nanotoxicology 2017; 11(4):475-83. doi: 10.1080/17435390.2017.1310949 [Crossref] [ Google Scholar]
- Pan Y, Li T, Cheng J, Telesca D, Zink JI, Jiang J. Nano-QSAR modeling for predicting the cytotoxicity of metal oxide nanoparticles using novel descriptors. RSC Adv 2016; 6(31):25766-75. doi: 10.1039/c6ra01298a [Crossref] [ Google Scholar]
- Gajewicz A, Cronin MT, Rasulev B, Leszczynski J, Puzyn T. Novel approach for efficient predictions properties of large pool of nanomaterials based on limited set of species: nano-read-across. Nanotechnology 2015; 26(1):015701. doi: 10.1088/0957-4484/26/1/015701 [Crossref] [ Google Scholar]
- Toropova AP, Toropov AA, Manganelli S, Leone C, Baderna D, Benfenati E. Quasi-SMILES as a tool to utilize eclectic data for predicting the behavior of nanomaterials. NanoImpact 2016; 1:60-4. doi: 10.1016/j.impact.2016.04.003 [Crossref] [ Google Scholar]
- Kaweeteerawat C, Ivask A, Liu R, Zhang H, Chang CH, Low-Kam C. Toxicity of metal oxide nanoparticles in Escherichia coli correlates with conduction band and hydration energies. Environ Sci Technol 2015; 49(2):1105-12. doi: 10.1021/es504259s [Crossref] [ Google Scholar]
- Fields FR, Freed SD, Carothers KE, Hamid MN, Hammers DE, Ross JN. Novel antimicrobial peptide discovery using machine learning and biophysical selection of minimal bacteriocin domains. Drug Dev Res 2020; 81(1):43-51. doi: 10.1002/ddr.21601 [Crossref] [ Google Scholar]
- Roy J, Roy K. Modeling and mechanistic understanding of cytotoxicity of metal oxide nanoparticles (MeOxNPs) to Escherichia coli: categorization and data gap filling for untested metal oxides. Nanotoxicology 2022; 16(2):152-64. doi: 10.1080/17435390.2022.2038299 [Crossref] [ Google Scholar]
- Kar S, Pathakoti K, Tchounwou PB, Leszczynska D, Leszczynski J. Evaluating the cytotoxicity of a large pool of metal oxide nanoparticles to Escherichia coli: mechanistic understanding through in vitro and in silico studies. Chemosphere 2021; 264(Pt 1):128428. doi: 10.1016/j.chemosphere.2020.128428 [Crossref] [ Google Scholar]
- Kuz’min VE, Ognichenko LN, Sizochenko N, Chapkin VA, Stelmakh SI, Shyrykalova AO. Combining features of metal oxide nanoparticles: nano-QSAR for cytotoxicity. International Journal of Quantitative Structure-Property Relationships (IJQSPR) 2019; 4(1):28-40. doi: 10.4018/ijqspr.2019010103 [Crossref] [ Google Scholar]
- Robnik-Šikonja M, Kononenko I. Theoretical and empirical analysis of ReliefF and RReliefF. Mach Learn 2003; 53(1):23-69. doi: 10.1023/a:1025667309714 [Crossref] [ Google Scholar]
- Erdemir A, Li S, Jin Y. Relation of certain quantum chemical parameters to lubrication behavior of solid oxides. Int J Mol Sci 2005; 6(6):203-18. doi: 10.3390/i6060203 [Crossref] [ Google Scholar]
- Alaraby M, Hernández A, Marcos R. New insights in the acute toxic/genotoxic effects of CuO nanoparticles in the in vivo Drosophila model. Nanotoxicology 2016; 10(6):749-60. doi: 10.3109/17435390.2015.1121413 [Crossref] [ Google Scholar]
- Wang B, Zhang Y, Mao Z, Yu D, Gao C. Toxicity of ZnO nanoparticles to macrophages due to cell uptake and intracellular release of zinc ions. J Nanosci Nanotechnol 2014; 14(8):5688-96. doi: 10.1166/jnn.2014.8876 [Crossref] [ Google Scholar]
- Wang D, Lin Z, Wang T, Yao Z, Qin M, Zheng S. Where does the toxicity of metal oxide nanoparticles come from: the nanoparticles, the ions, or a combination of both?. J Hazard Mater 2016; 308:328-34. doi: 10.1016/j.jhazmat.2016.01.066 [Crossref] [ Google Scholar]
- Heinlaan M, Ivask A, Blinova I, Dubourguier HC, Kahru A. Toxicity of nanosized and bulk ZnO, CuO and TiO2 to bacteria Vibrio fischeri and crustaceans Daphnia magna and Thamnocephalusplatyurus. Chemosphere 2008; 71(7):1308-16. doi: 10.1016/j.chemosphere.2007.11.047 [Crossref] [ Google Scholar]
- Auffan M, Rose J, Wiesner MR, Bottero JY. Chemical stability of metallic nanoparticles: a parameter controlling their potential cellular toxicity in vitro. Environ Pollut 2009; 157(4):1127-33. doi: 10.1016/j.envpol.2008.10.002 [Crossref] [ Google Scholar]
- Neal AL. What can be inferred from bacterium-nanoparticle interactions about the potential consequences of environmental exposure to nanoparticles?. Ecotoxicology 2008; 17(5):362-71. doi: 10.1007/s10646-008-0217-x [Crossref] [ Google Scholar]
- Lo YC, Rensi SE, Torng W, Altman RB. Machine learning in chemoinformatics and drug discovery. Drug Discov Today 2018; 23(8):1538-46. doi: 10.1016/j.drudis.2018.05.010 [Crossref] [ Google Scholar]
- Sharma AK, Srivastava GN, Roy A, Sharma VK. ToxiM: a toxicity prediction tool for small molecules developed using machine learning and chemoinformatics approaches. Front Pharmacol 2017; 8:880. doi: 10.3389/fphar.2017.00880 [Crossref] [ Google Scholar]
- Sreelatha R, Bharanidharan S. Chemo informatics QSAR analysis of nitroaromatic compounds toxicity. Int J Pure Appl Math 2018; 119(12):7145-54. [ Google Scholar]
- Mikolajczyk A, Sizochenko N, Mulkiewicz E, Malankowska A, Rasulev B, Puzyn T. A chemoinformatics approach for the characterization of hybrid nanomaterials: safer and efficient design perspective. Nanoscale 2019; 11(24):11808-18. doi: 10.1039/c9nr01162e [Crossref] [ Google Scholar]
- DeForest DK, Brix KV, Tear LM, Adams WJ. Multiple linear regression models for predicting chronic aluminum toxicity to freshwater aquatic organisms and developing water quality guidelines. Environ Toxicol Chem 2018; 37(1):80-90. doi: 10.1002/etc.3922 [Crossref] [ Google Scholar]
- Schuld M, Sinayskiy I, Petruccione F. Prediction by linear regression on a quantum computer. Phys Rev A 2016; 94(2):022342. doi: 10.1103/PhysRevA.94.022342 [Crossref] [ Google Scholar]
- Casson RJ, Farmer LD. Understanding and checking the assumptions of linear regression: a primer for medical researchers. Clin Exp Ophthalmol 2014; 42(6):590-6. doi: 10.1111/ceo.12358 [Crossref] [ Google Scholar]
- Abdulrazaq MB, Mahmood MR, Zeebaree SR, Abdulwahab MH, Zebari RR, Sallow AB. An analytical appraisal for supervised classifiers’ performance on facial expression recognition based on relief-F feature selection. J Phys Conf Ser 2021; 1804(1):012055. doi: 10.1088/1742-6596/1804/1/012055 [Crossref] [ Google Scholar]
- Manhrawy IIM, Qaraad M, El-Kafrawy P. Hybrid feature selection model based on relief-based algorithms and regulizer algorithms for cancer classification. Concurr Comput 2021; 33(17):e6200. doi: 10.1002/cpe.6200 [Crossref] [ Google Scholar]
- Kumari N, Anwar S, Bhattacharjee V. Correlation and relief attribute rank-based feature selection methods for detection of alcoholic disorder using electroencephalogram signals. IETE J Res 2022; 68(5):3816-28. doi: 10.1080/03772063.2020.1780166 [Crossref] [ Google Scholar]
- Urbanowicz RJ, Olson RS, Schmitt P, Meeker M, Moore JH. Benchmarking relief-based feature selection methods for bioinformatics data mining. J Biomed Inform 2018; 85:168-88. doi: 10.1016/j.jbi.2018.07.015 [Crossref] [ Google Scholar]
- Babayevska N, Przysiecka Ł, Iatsunskyi I, Nowaczyk G, Jarek M, Janiszewska E. ZnO size and shape effect on antibacterial activity and cytotoxicity profile. Sci Rep 2022; 12(1):8148. doi: 10.1038/s41598-022-12134-3 [Crossref] [ Google Scholar]
- Zheng H, Zhong B, Wang Q, Li X, Chen J, Liu L. ZnO-doped metal-organic frameworks nanoparticles: antibacterial activity and mechanisms. Int J Mol Sci 2023; 24(15):12238. doi: 10.3390/ijms241512238 [Crossref] [ Google Scholar]
- Massoumi H, Kumar R, Chug MK, Qian Y, Brisbois EJ. Nitric oxide release and antibacterial efficacy analyses of S-nitroso-N-acetyl-penicillamine conjugated to titanium dioxide nanoparticles. ACS Appl Bio Mater 2022; 5(5):2285-95. doi: 10.1021/acsabm.2c00131 [Crossref] [ Google Scholar]
- Fathy Abo-Elmahasen MM, Abo Dena AS, Zhran M, Albohy SA. Do silver/hydroxyapatite and zinc oxide nano-coatings improve inflammation around titanium orthodontic mini-screws? In vitro study. Int Orthod 2023; 21(1):100711. doi: 10.1016/j.ortho.2022.100711 [Crossref] [ Google Scholar]
- Toropova AP, Toropov AA. CORAL: Monte Carlo method to predict endpoints for medical chemistry. Mini Rev Med Chem 2018; 18(5):382-91. doi: 10.2174/1389557517666170927154931 [Crossref] [ Google Scholar]
- Siani P, Frigerio G, Donadoni E, Di Valentin C. Molecular dynamics simulations of cRGD-conjugated PEGylated TiO2 nanoparticles for targeted photodynamic therapy. J Colloid Interface Sci 2022; 627:126-41. doi: 10.1016/j.jcis.2022.07.045 [Crossref] [ Google Scholar]
- Bicherel P, Thomas PC. Aquatic toxicity calculation of mixtures: a chemical activity approach incorporating a bioavailability reduction concept. Environ Sci Technol 2021; 55(16):11183-91. doi: 10.1021/acs.est.1c04389 [Crossref] [ Google Scholar]