Int J Drug Res Clin. 2:e12.
doi: 10.34172/ijdrc.2024.e12
Original Article
Trend of Staple Food Consumption Among Iranian Households Using National Household Budget Survey Data: Interaction with Socio-demographic Measurements
Zahra Mollarasouli 1, Fatemeh Abdi 2, Alireza Rahimi Mamaghani 3, Mahdieh Abbasalizad Farhangi 2, * 
Author information:
1Drug Applied Research Center, Tabriz University of Medical Sciences, Tabriz, Iran
2Department of Community Nutrition, Faculty of Nutrition, Tabriz University of Medical Sciences, Tabriz, Iran
3Clinical Research Development, Unit of Tabriz Valiasr Hospital, Tabriz University of Medical Science, Tabriz, Iran
Abstract
Background:
This study aimed to examine the phenomenon of nutrition transfer in Iran from 2002 to 2017 and explore the evidence for effective policy for a healthier country.
Methods:
A repeated cross-sectional study was conducted using data from the Central Bank of Statistics of the Islamic Republic of Iran. The per capita staple food consumption data of 212567 households in 79 cities were analyzed annually from 2002 to 2017. The study employed a structural equation modeling (SEM) approach to analyze the interaction between staple food patterns, demographic factors, and socio-economic changes.
Results:
The analysis of 16-year trends in per capita (kg/household/year) consumption of food commodities in Iran between 2002 and 2017 revealed a significant decrease in the consumption of rice and bread, which are the main contributors to the Iranian diet. Furthermore, the price index (PI) indicated a negative association with the per capita intake of rice, bread, and red meat.
Conclusion:
The findings suggest that the increase in food costs is associated with a significant reduction in the per capita consumption of staple foods and overall calorie intake.
Keywords: Staple food, Trend analysis, Households, Interaction, Iran
Copyright and License Information
© 2024 The Author(s).
This is an open access article distributed under the terms of the Creative Commons Attribution License (
http://creativecommons.org/licenses/by/4.0/), which permits unrestricted use, distribution, and reproduction in any medium, provided the original work is properly cited.
Funding Statement
None.
Please cite this article as follows: Mollarasouli Z, Abdi F, Rahimi Mamaghani A, Abbasalizad Farhangi M. Trend of staple food consumption among Iranian households using national household budget survey data: interaction with socio-demographic measurements. Int J Drug Res Clin. 2024; 2: e12. doi: 10.34172/ijdrc.2024.e12
Introduction
Dietary consumption and food patterns have undergone significant transformations in low- and middle-income countries in recent decades.1 The term “nutrition transition” refers to changes in dietary patterns at the community or population level, which are associated with an increased level of nutrition-related non-communicable diseases such as diabetes, cardiovascular disease, osteoporosis, and certain types of cancers.2,3 The World Health Organization (WHO) highlights that nutrition transition is exacerbated by factors such as reduced physical activity, stressful lifestyles, high alcohol consumption, and smoking.4 Globalization, rapid urbanization, economic development, growth of mass media, and increased industrialization are contributing factors to these dietary changes.5-8 Moreover, food cost exerts an impact on diet quality, leading to social inequalities in health. Food and nutrition play an important role in health disparities as individuals with lower income tend to purchase energy-dense foods (high in fat and sugar) due to their lower cost per unit of energy compared to nutrient-rich foods (e.g., fruits and vegetables).9 A conclusion drawn from studies on social gradients in obesity rates is that the association between poverty and obesity may be due to the low cost of energy-dense foods, which is reinforced by the high palatability of sugar and fat.10 Additionally, fatty and sweet foods are easy to consume.11-13 The convenience, availability, and palatability of fatty and sweet foods contribute to their consumption and subsequent weight gain.14-17
The pattern of social inequality in health and diet quality is observed in most industrialized countries, including the United States,18 France,19 Ireland,20 the United Kingdom,21 Australia,22 Belgium,23 and Finland.24 Published evidence on the association between diet quality and socio-economic status is largely based on cross-sectional studies, which can be used to generate hypotheses but do not prove causation. Therefore, modeling French dietary patterns in the absence of longitudinal cohort studies has provided new perspectives on how a restriction in dietary expenditure can negatively impact diet quality and health. Notably, imposing strict constraints on dietary expenditure consistently resulted in energy-dense but nutrient-poor dietary patterns similar to diets consumed by low-income groups.25,26 Accordingly, this study aimed to analyze the consumption pattern of four staple food items in Iran from 2002 to 2017 using data from the Central Bank of the Islamic Republic of Iran, incorporating socio-economic factors into the analysis.
Methods
Data Collection
This cross-sectional study was conducted to investigate the nutrition transition in Iran using necessary data from official reports published by the Central Bank of the Islamic Republic of Iran. These reports provided valuable sources of data due to their reliability and credibility. To assess trends in food consumption, we focused on key food commodities that are integral to the Iranian diet. Per capita staple food consumption data were obtained for 212 567 households in 79 cities. Specifically, we collected data on the per capita consumption of bread, rice, red meat, and white meat, which were selected for their significant contribution to the overall food intake of Iranians. In addition to food consumption data, we collected demographic and socio-economic information, including variables such as education, occupation, age, price index (PI), and inflation index (IF). The data collection process spanned a period of 16 years, from 2002 to 2017. The accuracy and consistency of the data were ensured by relying on official reports from the Central Bank of the Islamic Republic of Iran.
Statistical Analysis
The data analysis was conducted using the statistical software STATA version 17. The consumption pattern of main foods was collected using the average annual consumption (year-by-year review) of a household during the years 2002 to 2017 through the official reports of the Central Bank of the Islamic Republic of Iran. This allowed us to capture trends in food consumption and evaluate changes occurring during the study period. To further analyze the data, we categorized the population into different age groups, specifically divided individuals into four age categories: category 1 representing those from birth to 20 years old, category 2 covering individuals between 20-40 years old, category 3 including individuals aged 40-60 years old, and category 4 consisting of people over 60 years old. Additionally, we examined the average household size to provide insights into household composition in terms of the number of individuals. Education and employment were also important factors considered in our analysis. Education level was measured by calculating the percentage of individuals within the population with a university education. Employment status was assessed by determining the percentage of individuals engaged in work within each household.
Path analysis was used as a tool for structural equation modeling (SEM) to determine the relationship between nutritional transition and demographic, social, and economic factors. It also helped identify the direct and indirect effects of independent variables on dependent ones.
Results
Trends in the Consumption of Major Food Commodities
Figures 1 and 2 present 16-year trends in per capita (kg/household/year) consumption of food commodities in Iran between 2002-2017. Calculations indicated a significant decrease in the consumption of rice and bread, which are major contributors to the food intake of Iranians. In 2002, the per capita intake of bread was 574 kg/household/year, plunging to 298 kg/household/year over the next 15 years. Similarly, there was a gradual decline in the per capita rice intake throughout the whole period, with a 42% decrease by 2017, resulting in a value of 106 kg/household/year. In contrast, the consumption of both types of meat (red and white) fluctuated during this period, while the overall intake of white meat altered slightly with a considerable decrease in red meat consumption. Red meat intake per capita was as high as 63 kg/household/year in 2002, varied between 59 and 64 until 2006, dropped below 59 in 2007, and continued to decrease, reaching 37 kg/household/year by 2017. Despite some variations in per capita white meat consumption, there was a 9.7% rise between 2002 and 2017.
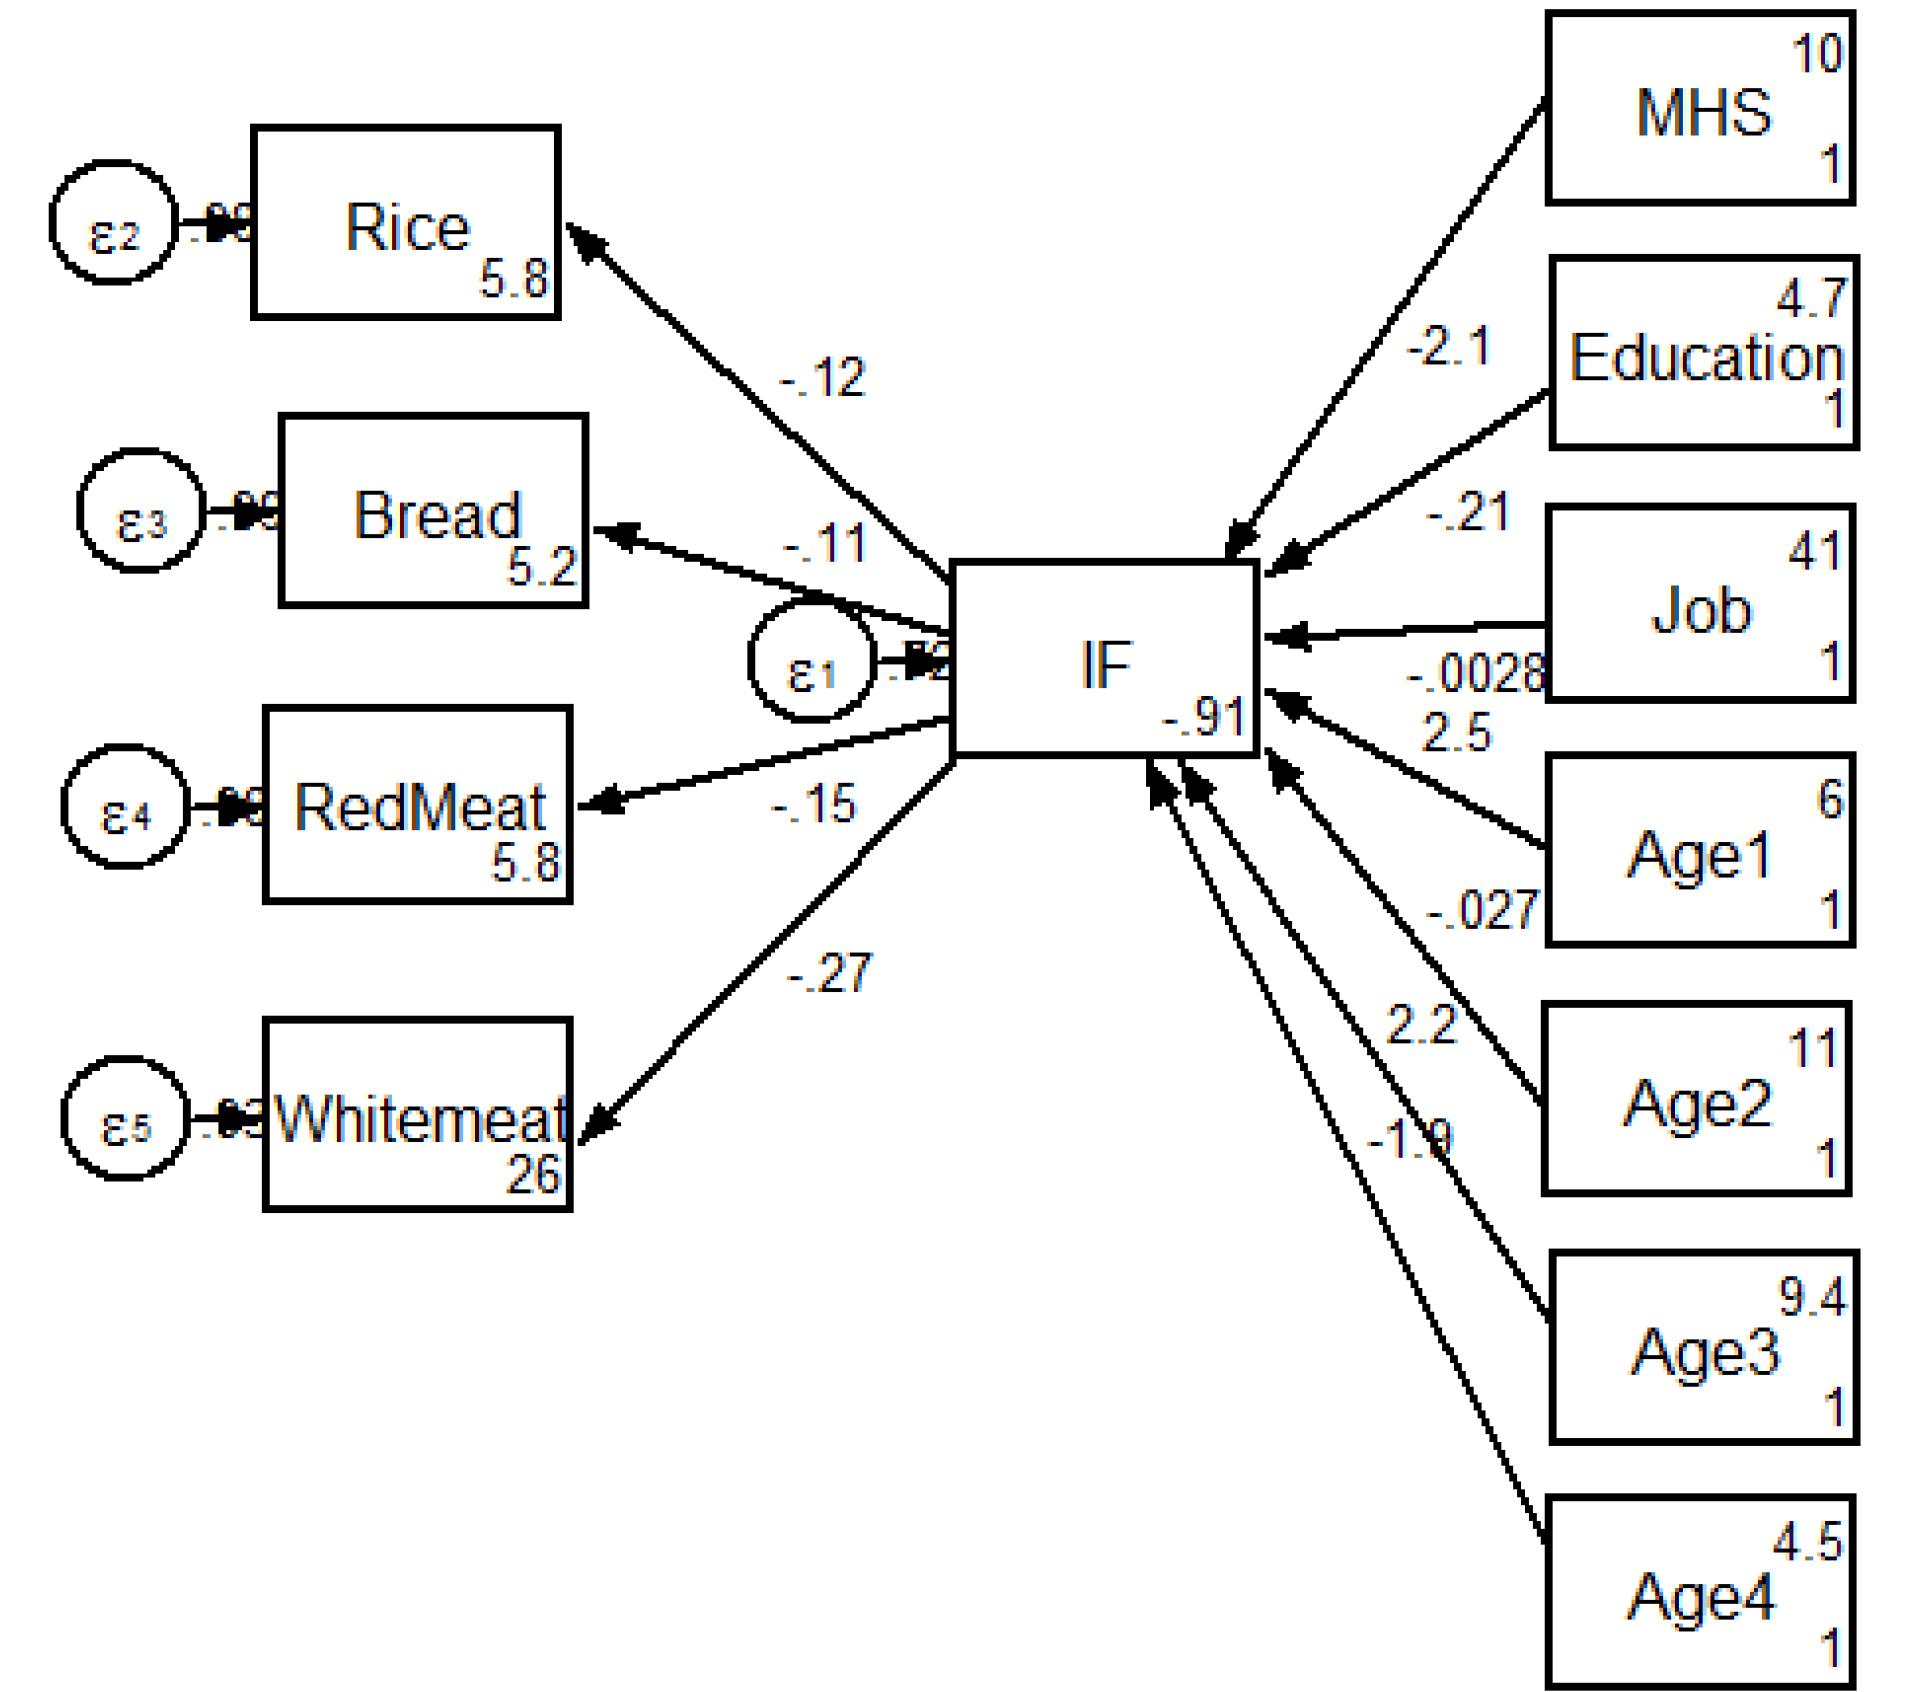
Figure 1.
Hypothesized Model in Which IF as A Mediating Variable Relates Socio-demographic Variables to Consumption of Major Food Commodities. Note. IF: Inflation index; MHS: Mean household size
.
Hypothesized Model in Which IF as A Mediating Variable Relates Socio-demographic Variables to Consumption of Major Food Commodities. Note. IF: Inflation index; MHS: Mean household size
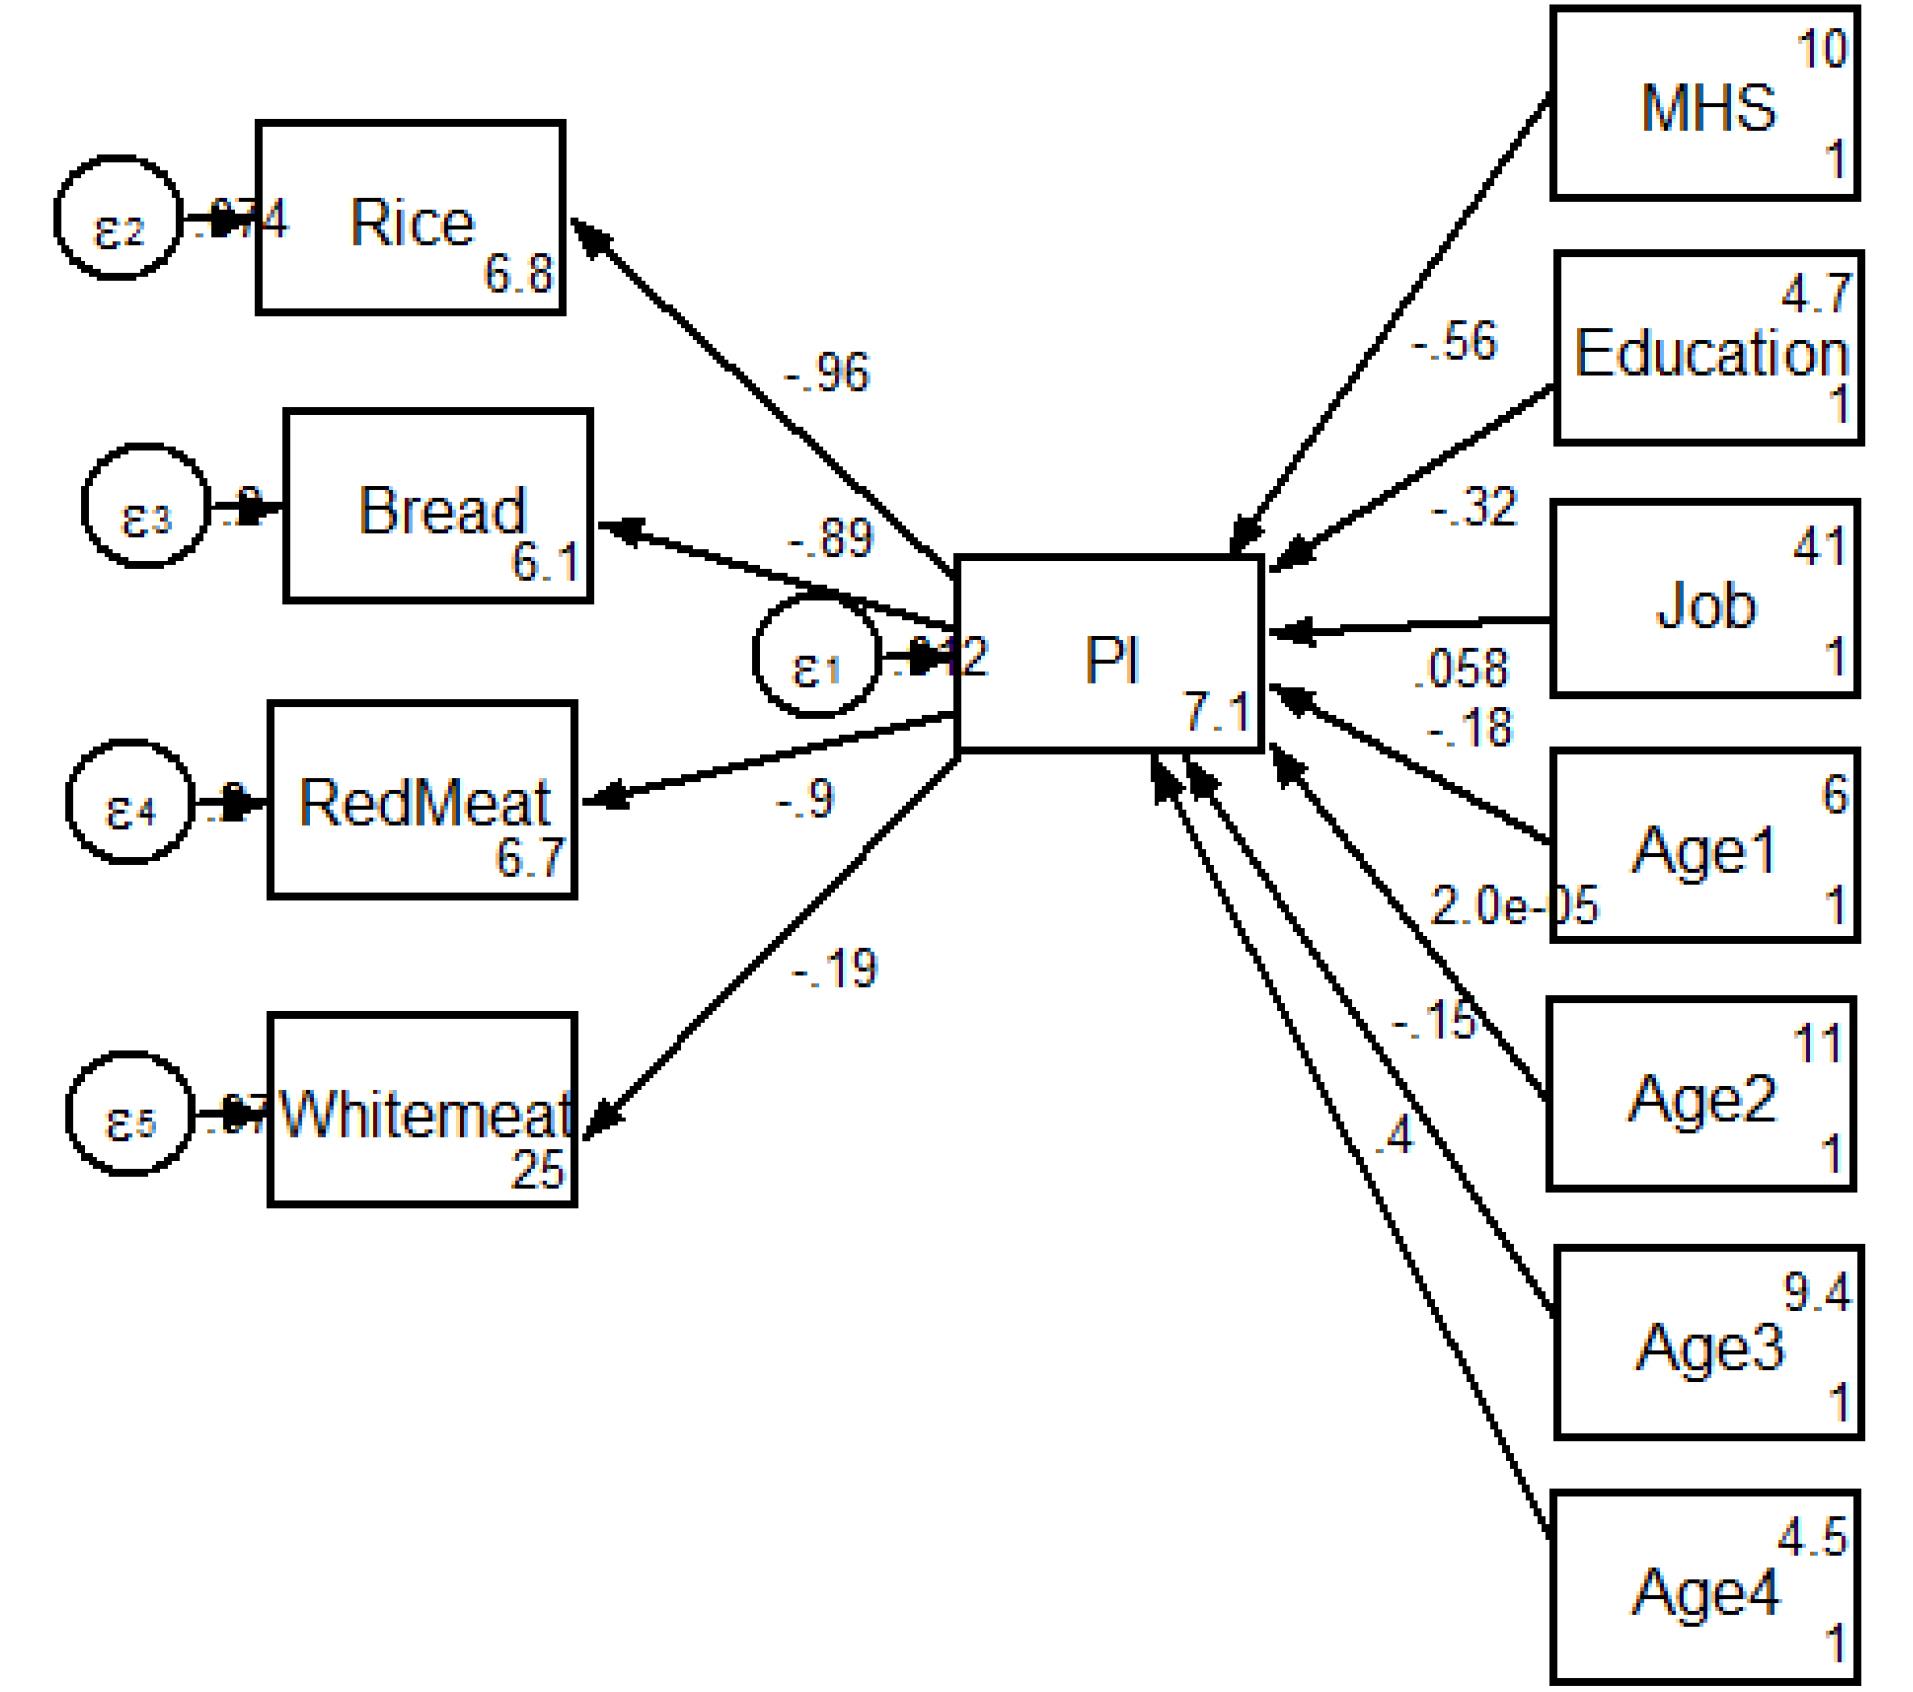
Figure 2.
Hypothesized Model in Which PI as A Mediating Variable Relates Socio-demographic Variables to Consumption of Major Food Commodities. Note. PI: Price index; MHS: Mean household size
.
Hypothesized Model in Which PI as A Mediating Variable Relates Socio-demographic Variables to Consumption of Major Food Commodities. Note. PI: Price index; MHS: Mean household size
Associations Between Price Index, Inflation Index, Socio-demographic Characteristics and Per Capita Intake of Certain Important Food Commodities
Figures 1 and 2 show the path analysis diagram with standardized estimates elucidating the total effects of socio-demographic characteristics and IF on per capita intake of major food commodities. Although the goodness-of-fit index of the final model exhibited an acceptable fit (χ2/ degrees of freedom (df) ratio < 5), no significant association was found between socio-demographic parameters, IF, and per capita consumption of specific commodities, including bread, rice, red meat, and white meat (Table 1). Figure 3 displays the relationships between socio-demographic variables, PI, and selected food commodities intake per capita in the form of a conceptual model tested by path analysis. Based on the results of path analysis, education was negatively associated with PI (β = -0.32, P < 0.05), as illustrated in Table 2. No significant relationship was revealed between other socio-demographic variables and PI.
However, negative associations were found between PI and the amounts of per capita intake of rice (β = -0.96, P < 0.05), bread (β = -0.89, P < 0.05), and red meat (β = -0.90, P < 0.05). Moreover, the presented model indicated a good fit to the observed data (χ2/df = 3.87).
Table 1.
Total Effects of Socio-demographic and IF on Food Commodities Using Path Analysis
|
|
Total e
|
|
Standardized Estimate
|
SE
|
P
Value
|
| MHS → IF |
-2.150 |
2.965 |
0.486 |
| Education → IF |
-0.209 |
0.610 |
0.732 |
| Job → IF |
-0.003 |
0.493 |
0.995 |
| Age 1a → IF |
2.487 |
4.496 |
0.580 |
| Age 2b → IF |
-0.027 |
0.294 |
0.926 |
| Age 3c → IF |
2.234 |
2.638 |
0.397 |
| Age 4d → IF |
-1.920 |
1.944 |
0.323 |
| IF → Rice |
-0.123 |
0.246 |
0.618 |
| IF → Bread |
-0.112 |
0.247 |
0.651 |
| IF → Red meat |
-0.154 |
0.244 |
0.529 |
| IF → White meat |
-0.267 |
0.232 |
0.249 |
Note. SE: Standard error of the estimate; MHS: Mean household size; IF: Inflation index; aAge group 1 (0-20 years); bAge group 2 (20-40 years); cAge group 3 (40-60 years); dAge group 4 ( > 60 years); eTotal effect is defined as the sum of direct and indirect effects.
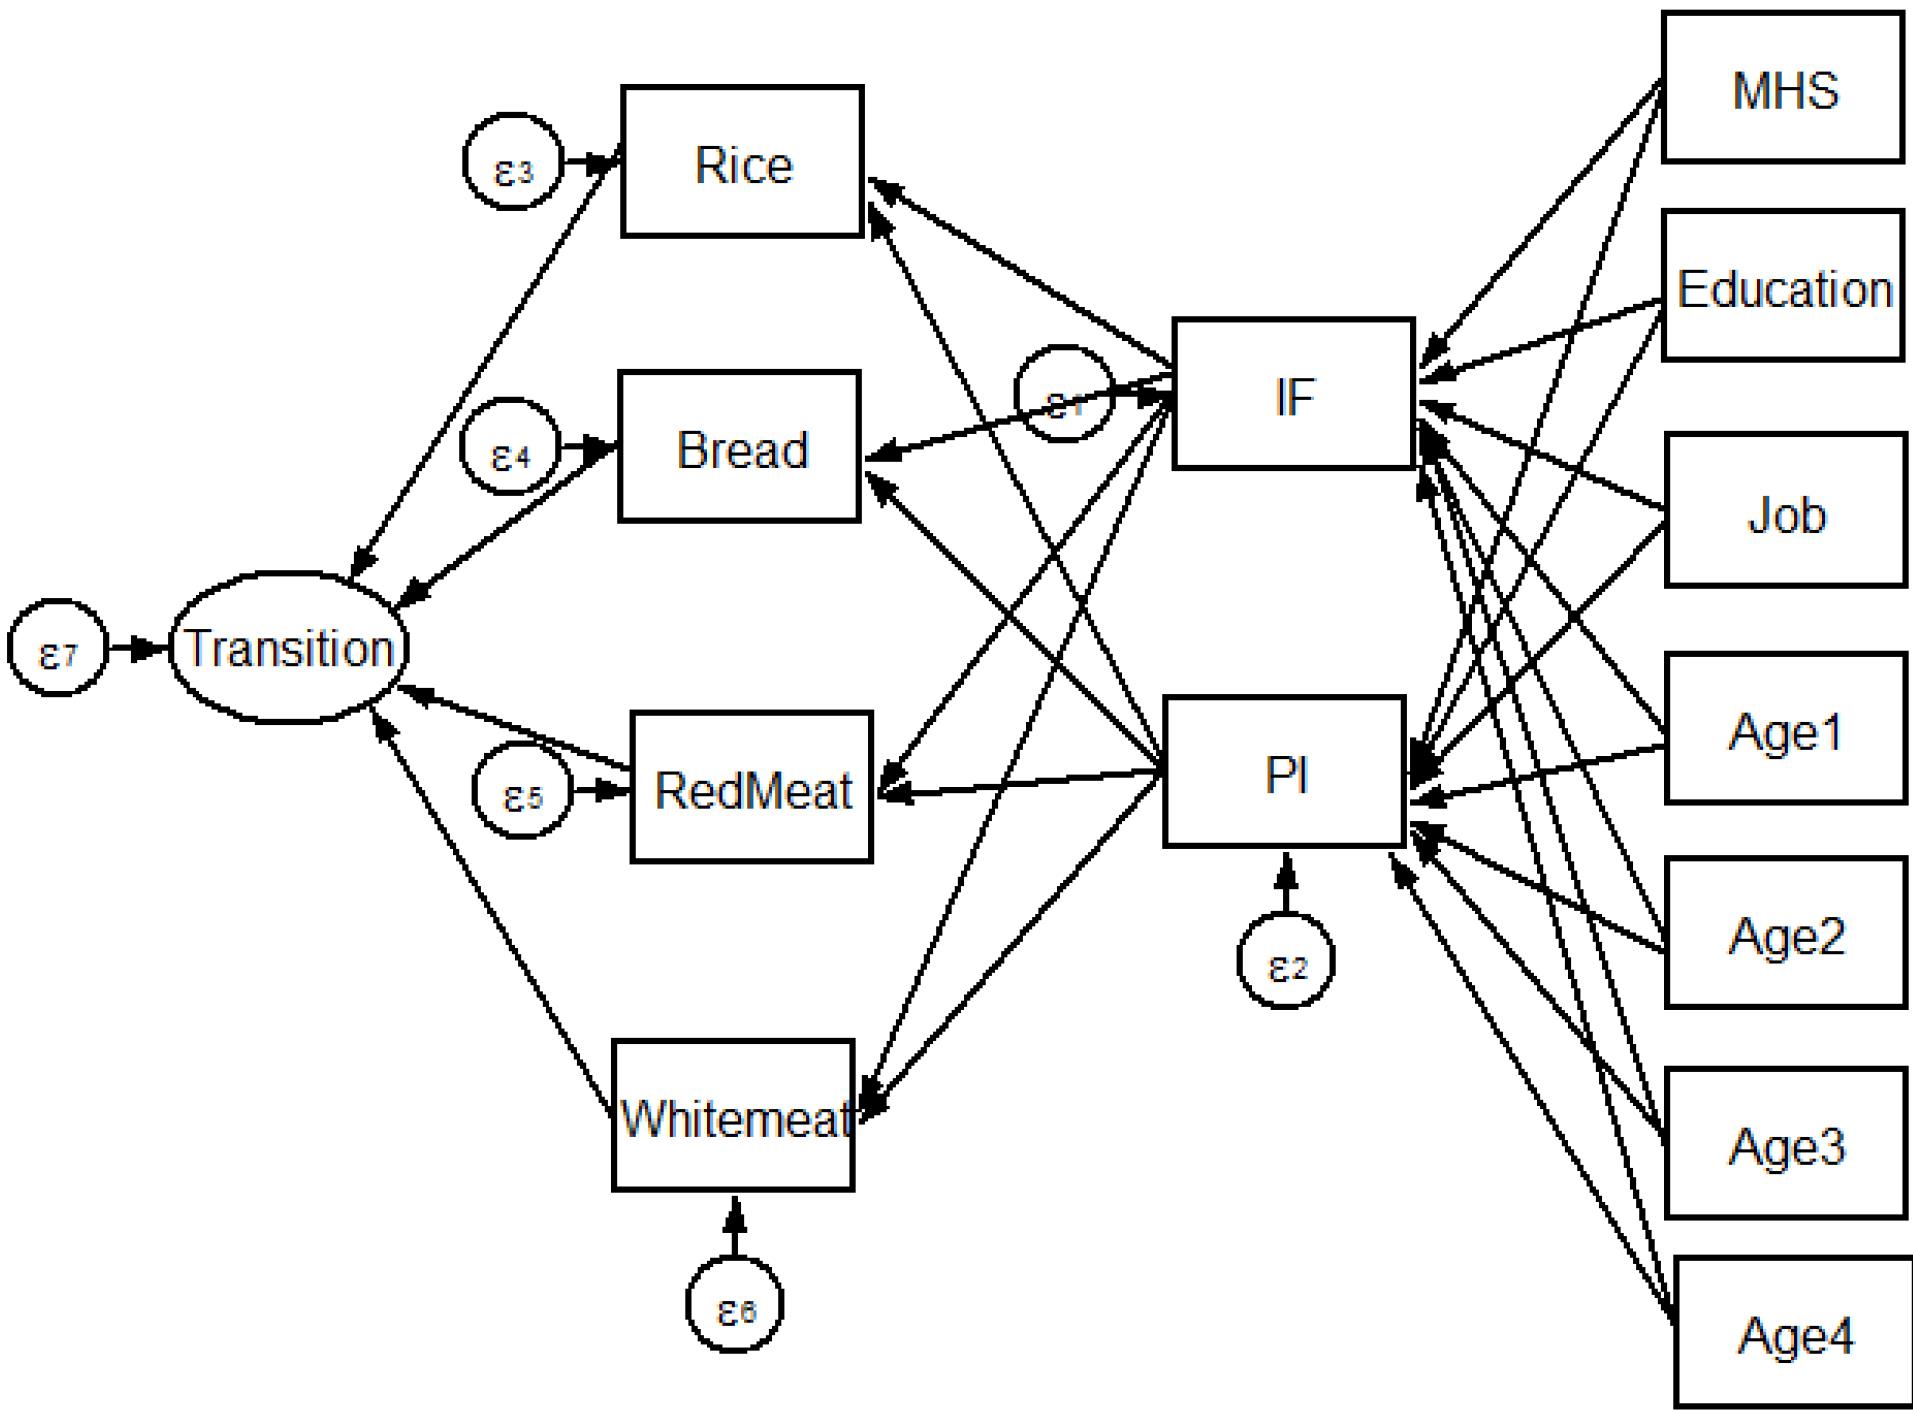
Figure 3.
Hypothesized Model in Which IF and PI as a Mediating Variable Relate Socio-demographic Variables to Transition. Note: IF: Inflation index; PI: Price index; MHS: Mean household size
.
Hypothesized Model in Which IF and PI as a Mediating Variable Relate Socio-demographic Variables to Transition. Note: IF: Inflation index; PI: Price index; MHS: Mean household size
Table 2.
Total Effects of Socio-demographic and PI on Food Commodities Using Path Analysis
|
|
Total e
|
|
Standardized Estimate
|
SE
|
P
Value
|
| MHS → PI |
-0.563 |
0.393 |
0.152 |
| Education → PI |
-0.322 |
0.079 |
0.000 |
| Job → PI |
0.058 |
0.064 |
0.365 |
| Age 1a → PI |
-0.184 |
0.592 |
0.756 |
| Age 2b → PI |
0.000 |
0.038 |
1.000 |
| Age 3c → PI |
-0.154 |
0.352 |
0.662 |
| Age 4d → PI |
0.397 |
0.261 |
0.129 |
| PI → Rice |
-0.962 |
0.014 |
0.000 |
| PI → Bread |
-0.892 |
0.040 |
0.000 |
| PI → Red meat |
-0.897 |
0.038 |
0.000 |
| PI → White meat |
-0.186 |
0.239 |
0.438 |
Note. SE: Standard error of the estimate; MHS: Mean household size; PI: Price index; aAge group 1 (0-20 years); bAge group 2 (20-40 years); cAge group 3 (40-60 years); dAge group 4 ( > 60 years); eTotal effect is defined as the sum of direct and indirect effects.
Discussion
This study investigated the nutritional trend of four food items, namely, rice, bread, red meat, and white meat in Iran from 2002 to 2017. The results suggested that the per capita consumption of rice and bread significantly decreased from 574 kg to 298 kg, and the per capita consumption of rice decreased from 182 kg to 106 kg in 2017. However, the consumption patterns for both types of meat fluctuated and were slightly different during this period. The consumption of red meat decreased from 63 kg to 37 kg, while the consumption of white meat increased from 82 kg to 90 kg. Consequently, the consumption of white meat rose by 8.8%, while the consumption of red meat, bread, and rice decreased by 41.2%, 48%, and 41.7%, respectively. Overall, no significant relationship was observed between the socio-demographic parameters, IF, and the per capita consumption of the four studied food items (P > 0.05). However, the level of education (β = -0.32, P < 0.05), rice consumption (β = -0.96, P < 0.05), red meat consumption (β = .90, P < 0.05), and bread consumption (β = -0.89, P < 0.05) per capita showed a negative relationship with PI.
In a study by Wang et al, conducted between 2010 and 2019 in the Qinghai-Tibet Plateau (QTP) region of China, protein consumption exceeded 70 gr/day due to the high consumption of beef, sheep, and milk before 1995. In subsequent years, as direct consumption of cereals decreased, the proportion of vegetable protein reduced, while the proportions of animal protein and high-quality protein increased annually. This study suggested that the per capita consumption of grains in this region was 262 kg, which seemed satisfactory. In other words, total grain consumption remained constant since 2010. Considering that over 75% of fruits and vegetables in QTP are supplied from other provinces, the security of grains, which are local products, is considered crucial for food security in the region.27
According to the current findings, the total per capita consumption of meat in Iran was 145 kg in 2002 reduced to 127 kg in 2017, which seems to have an 18 kg decrease. This finding is different from global meat consumption patterns in 2017, showing that per capita meat consumption was 14.23 kg in 1996 and increased to 35.98 kg in 2017, indicating a rise of over 20 kg. Moreover, in 2017, the per capita consumption of red meat in Turkey (38.87), Uzbekistan (34.41), Kyrgyzstan (30.46), Azerbaijan (34.08), Georgia (31.83), Mauritania (31.06), Jordan (37.91), Morocco (35.12), Bosnia and Herzegovina (36.03), and the Central African Republic (35.09) was almost the same as that in Iran.28 As shown by these statistics, per capita meat consumption increased by 20 kilograms between 1961 and 2014, with each person consuming an average of 43 kg of meat annually by 2014. This increase in the world indicates faster meat production compared to population growth, with the more remarkable growth of consumption in countries with a significant economic transition period 28. This value has increased 15- and 4-fold in China and Brazil respectively, from 1961 to 2014, and India maintained the lowest value of 4 kg per year in 2013. This value is almost the same as per capita in 1961, with its trend being remained almost constant, which could be due to the dominant lactovegetarian dietary preferences in India 29. According to the UN Food and Agriculture Organization (FAO) statistics, red meat consumption was highest in high-income countries (HIC) in 2017, with the maximum value in the United States (124.1 kg), followed by Australia (121.6 kg), Argentina (109.38 kg), and Spain (100.25 kg). It seems that the changes in per capita meat consumption were slower in HIC, and most of them have been stable or even decreased over the last 50 years. In Africa, the consumption trend was slightly different. In some countries, the per capita consumption is 10 kg, which is about half of the continental average, but consumption reaches 60 to 70 kg in South African countries.30 Feeding the world in a sustainable way is one of the most important challenges facing us, and Iran is no exception to this trend. Meat is a crucial source of nutrition globally, and its demand continues to rise.
Economic growth and urbanization are changing lifestyles and dietary patterns due to changes in the food environment, increased incomes, sedentary jobs, and superior time management.31 It seems that economic growth has a greater effect on changes in the consumption of such products in poorer countries.32 In the current study, per capita consumption is defined as kilograms per household per year, so it is not possible to compare its results with those of Marques and colleagues’ study.
Some studies showed that healthy diets are more expensive and less desirable in deprived and low-income communities.33 According to studies, low-income households are more concerned about hunger and are more likely to choose filling or high-satiating-value foods (e.g., starchy foods) over foods with high nutritional value.34 Cultural factors also seem to affect the food patterns of populations.35-37
The findings of this study have important implications for food and nutrition security, as well as health and environmental sustainability policies in Iran. Although increasing the production and supply of meat seems necessary to meet the growing demand of Iran’s population, several other factors should also be considered, including the impacts of climate change, health problems related to the consumption of animal foods, especially red meat, as well as the unstable political and economic conditions in Iran.
This study has some limitations, including the lack of comparison between urban and rural populations, failure to define the food items examined in each introduced classification, and the exclusion of eggs from the meat food group as a source of protein. Nevertheless, this study offers several strengths, including a 16-year longitudinal analysis that provides a comprehensive understanding of changing food consumption patterns over time. The use of national central bank data increases the reliability and generalizability of the findings. Furthermore, the study uses multivariate analysis to investigate the relationship between socio-demographic parameters and food consumption, contributing to the robustness of the findings. Comparison with other studies provides valuable background both in Iran and globally. Overall, these strengths increase the quality and significance of the study, making it a valuable resource for informing future policy decisions in Iran.
Conclusion
Considering the significant decrease in per capita consumption of meat in Iranian households, it seems that some health problems are caused by the lack of proteins. On the other hand, increased consumption of rice and bread may also be associated with issues related to weight and obesity. As such, it is necessary to promote the consumption of plant foods and plant protein sources, including all types of legumes, seeds, and vegetables, and to balance the consumption of grains such as rice, bread, and starchy foods.
Ethics statement
The work has been approved by the research undersecretary of Tabriz University of Medical Sciences (Code: IR.TBZMED.REC.1397.763).
Conflict of interests declaration
The authors declare that there is no conflict of interests.
Data availability statement
Data are available with reasonable request from corresponding author.
Author contributions
Conceptualization: Zahra Mollarasouli, Alireza Rahimi Mamaghani, Mahdieh Abbasalizad Farhangi.
Data curation: Zahra Mollarasouli, Mahdieh Abbasalizad Farhangi.
Formal analysis: Zahra Mollarasouli, Mahdieh Abbbasalizad Farhangi.
Funding acquisition: Alireza Rahimi Mamaghani, Mahdieh Abbasalizad Farhangi.
Investigation: Zahra Mollarasouli, Mahdieh Abbasalizad Farhangi.
Methodology: Zahra Mollarasouli, Mahdieh Abbasalizad Farhangi.
Project administration: Zahra Mollarasouli, Fatemeh Abdi.
Resources: Alireza Rahimi Mamaghani, Mahdieh Abbasalizad Farhangi.
Software: Zahra Mollarasouli, Mahdieh Abbasalizad Farhangi.
Supervision: Mahdieh Abbasalizad Farhangi.
Validation: Zahra Mollarasouli, Mahdieh Abbasalizad Farhangi.
Visualization: Zahra Mollarasouli, Mahdieh Abbasalizad Farhangi.
Writing–original draft: Zahra Mollarasouli, Mahdieh Abbasalizad Farhangi.
Writing–review & editing: Alireza Rahimi Mamaghani, Fatemeh Abdi, Mahdieh Abbasalizad Farhangi.
Consent for publication
None.
References
- Popkin BM, Gordon-Larsen P. The nutrition transition: worldwide obesity dynamics and their determinants. Int J Obes Relat Metab Disord 2004; 28 Suppl 3:S2-9. doi: 10.1038/sj.ijo.0802804 [Crossref] [ Google Scholar]
- Diet, nutrition and the prevention of chronic diseases. World Health Organ Tech Rep Ser 2003;916:1-149.
- Mattei J, Malik V, Wedick NM, Campos H, Spiegelman D, Willett W. A symposium and workshop report from the Global Nutrition and Epidemiologic Transition Initiative: nutrition transition and the global burden of type 2 diabetes. Br J Nutr 2012; 108(7):1325-35. doi: 10.1017/s0007114512003200 [Crossref] [ Google Scholar]
- Amuna P, Zotor FB. Epidemiological and nutrition transition in developing countries: impact on human health and development: the epidemiological and nutrition transition in developing countries: evolving trends and their impact in public health and human development. Proc Nutr Soc 2008; 67(1):82-90. doi: 10.1017/s0029665108006058 [Crossref] [ Google Scholar]
- Monteiro CA, Conde WL, Popkin BM. The burden of disease from undernutrition and overnutrition in countries undergoing rapid nutrition transition: a view from Brazil. Am J Public Health 2004; 94(3):433-4. doi: 10.2105/ajph.94.3.433 [Crossref] [ Google Scholar]
- Popkin BM. The nutrition transition in low-income countries: an emerging crisis. Nutr Rev 1994; 52(9):285-98. doi: 10.1111/j.1753-4887.1994.tb01460.x [Crossref] [ Google Scholar]
- Galal O. Nutrition-related health patterns in the Middle East. Asia Pac J Clin Nutr 2003; 12(3):337-43. [ Google Scholar]
- Bermudez OI, Tucker KL. Trends in dietary patterns of Latin American populations. Cad Saude Publica 2003; 19 Suppl 1:S87-99. doi: 10.1590/s0102-311x2003000700010 [Crossref] [ Google Scholar]
- James WP, Nelson M, Ralph A, Leather S. Socioeconomic determinants of health The contribution of nutrition to inequalities in health. BMJ 1997; 314(7093):1545-9. doi: 10.1136/bmj.314.7093.1545 [Crossref] [ Google Scholar]
- Drewnowski A, Specter SE. Poverty and obesity: the role of energy density and energy costs. Am J Clin Nutr 2004; 79(1):6-16. doi: 10.1093/ajcn/79.1.6 [Crossref] [ Google Scholar]
- McCrory MA, Saltzman E, Rolls BJ, Roberts SB. A twin study of the effects of energy density and palatability on energy intake of individual foods. Physiol Behav 2006; 87(3):451-9. doi: 10.1016/j.physbeh.2004.10.025 [Crossref] [ Google Scholar]
- Lissner L, Levitsky DA, Strupp BJ, Kalkwarf HJ, Roe DA. Dietary fat and the regulation of energy intake in human subjects. Am J Clin Nutr 1987; 46(6):886-92. doi: 10.1093/ajcn/46.6.886 [Crossref] [ Google Scholar]
- Rolls BJ, Bell EA. Intake of fat and carbohydrate: role of energy density. Eur J Clin Nutr 1999; 53 Suppl 1:S166-73. doi: 10.1038/sj.ejcn.1600757 [Crossref] [ Google Scholar]
- Drewnowski A. Energy density, palatability, and satiety: implications for weight control. Nutr Rev 1998; 56(12):347-53. doi: 10.1111/j.1753-4887.1998.tb01677.x [Crossref] [ Google Scholar]
- Drewnowski A. Fat and sugar: an economic analysis. J Nutr 2003; 133(3):838S-40S. doi: 10.1093/jn/133.3.838S [Crossref] [ Google Scholar]
- Drewnowski A. The real contribution of added sugars and fats to obesity. Epidemiol Rev 2007; 29:160-71. doi: 10.1093/epirev/mxm011 [Crossref] [ Google Scholar]
- Ledikwe JH, Blanck HM, Kettel Khan L, Serdula MK, Seymour JD, Tohill BC. Dietary energy density is associated with energy intake and weight status in US adults. Am J Clin Nutr 2006; 83(6):1362-8. doi: 10.1093/ajcn/83.6.1362 [Crossref] [ Google Scholar]
- Raffensperger S, Kuczmarski MF, Hotchkiss L, Cotugna N, Evans MK, Zonderman AB. Effect of race and predictors of socioeconomic status on diet quality in the HANDLS study sample. J Natl Med Assoc 2010; 102(10):923-30. doi: 10.1016/s0027-9684(15)30711-2 [Crossref] [ Google Scholar]
- Malon A, Deschamps V, Salanave B, Vernay M, Szego E, Estaquio C. Compliance with French nutrition and health program recommendations is strongly associated with socioeconomic characteristics in the general adult population. J Am Diet Assoc 2010; 110(6):848-56. doi: 10.1016/j.jada.2010.03.027 [Crossref] [ Google Scholar]
- Harrington J, Fitzgerald AP, Layte R, Lutomski J, Molcho M, Perry IJ. Sociodemographic, health and lifestyle predictors of poor diets. Public Health Nutr 2011; 14(12):2166-75. doi: 10.1017/s136898001100098x [Crossref] [ Google Scholar]
- Northstone K, Emmett PM. Dietary patterns of men in ALSPAC: associations with socio-demographic and lifestyle characteristics, nutrient intake and comparison with women’s dietary patterns. Eur J Clin Nutr 2010; 64(9):978-86. doi: 10.1038/ejcn.2010.102 [Crossref] [ Google Scholar]
- McNaughton SA, Ball K, Crawford D, Mishra GD. An index of diet and eating patterns is a valid measure of diet quality in an Australian population. J Nutr 2008; 138(1):86-93. doi: 10.1093/jn/138.1.86 [Crossref] [ Google Scholar]
- Mullie P, Clarys P, Hulens M, Vansant G. Dietary patterns and socioeconomic position. Eur J Clin Nutr 2010; 64(3):231-8. doi: 10.1038/ejcn.2009.145 [Crossref] [ Google Scholar]
- Lallukka T, Laaksonen M, Rahkonen O, Roos E, Lahelma E. Multiple socio-economic circumstances and healthy food habits. Eur J Clin Nutr 2007; 61(6):701-10. doi: 10.1038/sj.ejcn.1602583 [Crossref] [ Google Scholar]
- Darmon N, Ferguson EL, Briend A. A cost constraint alone has adverse effects on food selection and nutrient density: an analysis of human diets by linear programming. J Nutr 2002; 132(12):3764-71. doi: 10.1093/jn/132.12.3764 [Crossref] [ Google Scholar]
- Darmon N, Ferguson E, Briend A. Do economic constraints encourage the selection of energy dense diets?. Appetite 2003; 41(3):315-22. doi: 10.1016/s0195-6663(03)00113-2 [Crossref] [ Google Scholar]
- Wang L, Xiao Y, Ouyang Z. Food and grain consumption per capita in the Qinghai-Tibet plateau and implications for conservation. Nutrients 2021; 13(11):3742. doi: 10.3390/nu13113742 [Crossref] [ Google Scholar]
- Ritchie H, Rosado P, Roser M. Meat and Dairy Production. Our World in Data; 2017.
- Rammohan A, Awofeso N, Robitaille MC. Addressing female iron-deficiency anaemia in India: is vegetarianism the major obstacle?. ISRN Public Health 2012; 2012:765476. doi: 10.5402/2012/765476 [Crossref] [ Google Scholar]
- Ritchie H, Roser M. Meat and Seafood Production & Consumption. Our World in Data; 2017.
- Kuuire VZ, Bisung E, Were JM. Examining the connection between residential histories and obesity among Ghanaians: evidence from a national survey. Z Gesundh Wiss 2019; 27(5):569-79. doi: 10.1007/s10389-018-0983-8 [Crossref] [ Google Scholar]
- Marques AC, Fuinhas JA, Pais DF. Economic growth, sustainable development and food consumption: evidence across different income groups of countries. J Clean Prod 2018; 196:245-58. doi: 10.1016/j.jclepro.2018.06.011 [Crossref] [ Google Scholar]
- Zhang JF. Records of bizarre Jurassic brachycerans in the Daohugou biota, China (Diptera, Brachycera, Archisargidae and Rhagionemestriidae). Palaeontology 2010; 53(2):307-17. doi: 10.1111/j.1475-4983.2010.00934.x [Crossref] [ Google Scholar]
- Kennedy L. Poor Diet is the Result of Poverty Not Lack of Education. The Conversation; 2021.
- Hagan Jnr JE, Nsiah-Asamoah C, Hormenu T, Pollmann D, Schack T. Managing overweight and obesity in Ghana from a cultural lens: the complementary role of behaviour modification. J Prev Med Care 2018; 2(2):18-31. doi: 10.14302/issn.2474-3585.jpmc-18-2059 [Crossref] [ Google Scholar]
- Boatemaa S, Badasu DM, de-Graft Aikins A. Food beliefs and practices in urban poor communities in Accra: implications for health interventions. BMC Public Health 2018; 18(1):434. doi: 10.1186/s12889-018-5336-6 [Crossref] [ Google Scholar]
- Kruger HS, Puoane T, Senekal M, van der Merwe MT. Obesity in South Africa: challenges for government and health professionals. Public Health Nutr 2005; 8(5):491-500. doi: 10.1079/phn2005785 [Crossref] [ Google Scholar]