Int J Drug Res Clin. 2023;1:e7.
doi: 10.34172/ijdrc.2023.e7
Original Article
Effects of Sugar Substitution with Stevia on Physicochemical and Sensory Properties of Chocolate Milk
Arezoo Asghari 1  , Afshin Javadi 2, Zeinab Nikniaz 3, Fatollah Pourali 4, Leila Nikniaz 5, *
Author information:
1Student Research Committee, Tabriz University of Medical Sciences, Tabriz, Iran
2Department of Food Hygiene, Faculty of Veterinary Medicine, Tabriz Branch, Islamic Azad University, Tabriz, Iran
3Liver and Gastrointestinal Diseases Research Center, Tabriz University of Medical Sciences, Tabriz, Iran
4Nutrition Improvement Group, Tabriz University of Medical Sciences, Tabriz, Iran
5Tabriz Health Services Management Research Center, Health Management and Safety Promotion Research Institute, Tabriz University of Medical Sciences, Tabriz, Iran
Abstract
Background:
In this study, the effects of sugar substitution with stevia on physicochemical and sensory properties of chocolate milk were investigated.
Methods:
Chocolate milk samples were formulated using sugar, stevia, and inulin at different concentrations. A total of 19 different samples were obtained, and their physicochemical and sensory properties were evaluated.
Results:
The replacement of sugar with stevia led to a decrease in pH value and an increase in acidity level. The viscosity of samples containing 50% stevia was not significantly different from that of the control sample (P<0.05). Formulations 2 [50% sucrose (3.5 g/100 g), 50% stevia (0.012g/100g), and inulin (0.03 g/100 g)] and formulation 12 [20.27% sucrose (1.4 g/100 g), 79.73% stevia (0.018 g/100 g), and inulin (0.01 g/100 g)] had the lowest energy level and highest acceptability. They were not significantly different from the control sample in terms of acidity and viscosity.
Conclusion:
Stevia can partially be used as a substitute for sucrose without a significant effect on physicochemical characteristics and sensory properties of chocolate milk.
Keywords: Chocolate milk, Stevia, Sweetener, Inulin, Response surface methodology
Introduction
In recent decades, it has been widely accepted that food plays a key role in improving the physical condition and health of humans.1 However, it has been demonstrated that the consumption of foods containing large amounts of sucrose is associated with adverse health effects such as hypertension, cardiovascular diseases, tooth decay, obesity, and diabetes.2,3 Therefore, concerns about the nutritional and caloric value of food are increasing in recent years and consumers are interested in using healthier and safer products.3
There is a growing interest in the use of low-calorie alternatives to sucrose in the food industry.4 For this purpose, sweeteners have been used as substitutes for sugar in different foods and beverages.2,3,5 Therefore, the consumption of foods containing non-nutritive sweeteners has increased among people of all ages in recent years.1
Stevia, a natural sweetener, is a glycoside extracted from the leaves of S. rebaudiana(Bertoni). This plant is a shrub-like plant from the Asteraceae family, originating from South America.1,6 Because of consumer demand for natural foods and beverages, especially low-calorie ones, stevia has become increasingly popular in recent years6 and the attention of many scholars has been attracted to extracts of Stevia rebaudiana for its sweetening qualities.4 Glycosides such as rebaudioside A and stevioside, which are mainly found in the leaves of stevia, are responsible for the sweet taste of stevia.4,6 Stevioside and rebaudioside are 200-300 times sweeter than sucrose.7
Unlike artificial sweeteners, no adverse effects have been reported for stevia so far and it has been approved by the Joint Food and Agriculture Organization/World Organization Expert Committee on Food Additives. Stevia has also been reported to have beneficial effects on human health.2,8,9 It has been shown that stevia exhibits a dose-dependent hypoglycemic activity and reduces insulin resistance in humans. Additionally, itprevents the formation of dental plaque with bactericidal activity. Furthermore, this zero-calorie sweetener is suitable for use in the dietary plan of patients with diabetes and obesity.1,6,7,10 It also has some functional properties such as high stability in acidic and alkaline media, good solubility, and stability to heat (up to 200°C) and light.8,9 Stevia has recently been used as a no-calorie sweetener in baked goods, soft drinks, soy sauce, chewing gum, dairy products, and many other foods.1,8,9
Recently, several studies have been carried out on the effect of the substitution of sugar with stevia on the properties of varied products such as low-fat and whole milk set yoghurt,4 sucrose-free chocolate,11 fruit-based milk shake,12 cola and lemon-lime beverages,6 strawberry-flavored yoghurt,2 and carbonated drinks.13 Their results showed that stevia is a good alternative to sucrose in low-calorie products. However, there was little information about the use of stevia in chocolate milk.
The purposes of this research were (1) to optimize the levels of stevia to replace sucrose in producing reduced-calorie chocolate milk and (2) to compare the physicochemical characteristics and sensory properties of optimized formulation with the control sample.
Methods
Production of Chocolate Milk Samples
The UHT milk with 1.5% fat was purchased from Pegah Company (Tabriz, Iran). Stevia was purchased from Techfa Company (Tehran, Iran). Prior to the addition of stevia powder, it was diluted according to the manufacturer’s instructions. Chocolate milk samples were formulated using sugar, stevia, and inulin at different concentrations listed in Table 1. In this study, 19 different samples were obtained. After the addition of chocolate (%7) to the samples, they were homogenized by an agitator. Then, the samples were pasteurized at 78°C for 15 seconds and immediately cooled to < 4°C.
Table 1.
Coded and Actual Independent Variables (Sucrose, Stevia, and Inulin Concentrations) Used in the Response Surface Design
|
Formulation No.
|
Coded Independent Variables
|
Sucrose (%)
|
Actual Independent Variables
|
|
X1*
|
X2*
|
X3*
|
Sucrose (g/100 g)
|
Stevia (%)
|
Stevia (g/100 g)
|
Inulin (g/100 g)
|
| 1 |
-1 |
-1 |
+ 1 |
20.27 |
1.4 |
20.27 |
0.005 |
0.05 |
| 2 |
0 |
0 |
0 |
50 |
3.5 |
50 |
0.012 |
0.03 |
| 3 |
-1 |
-1 |
-1 |
20.27 |
1.4 |
20.27 |
0.005 |
0.01 |
| 4 |
+ 1.68 |
0 |
0 |
100 |
7 |
50 |
0.012 |
0.03 |
| 5 |
-1.68 |
0 |
0 |
0 |
0 |
50 |
0.012 |
0.03 |
| 6 |
0 |
0 |
0 |
50 |
3.5 |
50 |
0.012 |
0.03 |
| 7 |
+ 1 |
+ 1 |
-1 |
79.73 |
5.6 |
79.73 |
0.018 |
0.01 |
| 8 |
0 |
0 |
0 |
50 |
3.5 |
50 |
0.012 |
0.03 |
| 9 |
+ 1 |
+ 1 |
+ 1 |
79.73 |
5.6 |
79.73 |
0.018 |
0.05 |
| 10 |
0 |
0 |
+ 1.68 |
50 |
3.5 |
50 |
0.012 |
0.06 |
| 11 |
+ 1 |
-1 |
+ 1 |
79.73 |
5.6 |
20.27 |
0.005 |
0.05 |
| 12 |
-1 |
+ 1 |
-1 |
20.27 |
1.4 |
79.73 |
0.018 |
0.01 |
| 13 |
0 |
0 |
-1.68 |
50 |
3.5 |
50 |
0.012 |
0 |
| 14 |
0 |
-1.68 |
0 |
50 |
3.5 |
0 |
0 |
0.03 |
| 15 |
0 |
+ 1.68 |
0 |
50 |
3.5 |
100 |
0.023 |
0.03 |
| 16 |
-1 |
+ 1 |
+ 1 |
20.27 |
1.4 |
79.73 |
0.018 |
0.05 |
| 17 |
0 |
0 |
0 |
50 |
3.5 |
50 |
0.012 |
0.03 |
| 18 |
+ 1 |
-1 |
-1 |
79.73 |
5.6 |
20.27 |
0.005 |
0.01 |
| 19 |
+ 1.68 |
-1.68 |
-1.68 |
100 |
7 |
0 |
0 |
0 |
*Sucrose (X1) (0, 20.27, 50, 79.73, and 100%), stevia (X2) (0, 20.27, 50, 79.73, and 100%), and inulin (X3) (0, 0.01, 0.03, 0.05, and 0.06)
Physicochemical Characteristics
For this purpose, the pH of samples was measured using a pH meter (Model 430, Corning, USA) which was calibrated with pH 7 buffer. Acidity was evaluated by titration method using 0.1 N NaOH and reported in Dornic degrees (°D). The dry matter content of the samples was quantified by a moisture analyzer (Sartorius MA35, Germany) (AOAC, 2005). Viscosity was measured using a rheometer after 24 hours of production (Anton Paar, Austria) by spindle of R3 type with 200 RPM for 30 seconds.
Density was evaluated by a thermo-lactodensimeter (Anton Paar, Graz, Austria) which was calibrated with water and dry air (Valdez et al, 2001). The Gerber method was used to measure the fat content by a special calibrated butyrometer while protein was measured using the Kjeldahl method.14 Total sugar of the samples was evaluated by Fehling’s solution with methylene blue indicator.15 Energy was measured by the factors 4.0, 4.0, and 9.0 kcal/g for protein, carbohydrate, and fat, respectively. All tests were performed in triplicate for each treatment.
Evaluation of Sensory Properties
Eight trained panelists were selected for the evaluation of sensory properties. In order to assess the acceptance level of different formulations, a 5-point Likert scale (5 = extremely like, 4 = like, 3 = neither like nor dislike, 2 = dislike, and 1 = extremely dislike) was used. Taste, texture, and overall acceptability were compared between the samples as well as between the optimum formulations and the control sample (formulation No. 19) using Design Expert software version 6.0.2.
Statistical Analysis
To optimize physicochemical and sensory properties of chocolate milk, response surface methodology (RSM) was used. In this study, central composite design (RSMCC0318) with 18 tests (including four tests at the center point) was used. Independent variables were designed at five levels (-1.682, -1, 0, + 1, + 1.682), which included sucrose (X1) (0, 20.27, 50, 79.73, and 100%), stevia (X2) (0, 20.27, 50, 79.73, and 100%), and inulin (X3) (0, 0.01, 0.03, 0.05, and 0.06) (Table 1).
The experimental data matched with second degree polynomial equation, and the correlation coefficient was calculated. The quadratic polynomial equation used in the analysis was as follows:
In this equation, Y is the dependent variable or predicted response of the model. β0, βi, βii, and βij are regression coefficients for constant (intercept), linear, second-order, and quadratic effects, respectively. Xi and Xj are independent variables.
Dependent variables including pH, acidity, dry matter, viscosity, density, fat, protein, total sugar, and energy of samples were analyzed using one-way ANOVA and factorial analysis in a completely randomized design. Data were expressed as mean ± standard deviation. Data analysis was performed using SPSS version 16.0. P values lower than 0.05 were considered statistically significant. Duncan’s multiple-range test was used to compare the groups.
Results
The experimental results about the effect of sucrose, stevia, and inulin combination on the physicochemical properties of chocolate milk are shown in Table 2. Generally, these properties were affected by the level of processing factors. Results showed that the pH of samples ranged between 6.58 and 6.70. The lowest pH (6.58) and the highest acidity (16.5°D) belonged to treatment 5 containing 0% sucrose, 50% stevia, and 0.03% inulin. This formulation also had the minimum dry matter content (11.63%) and density (1.050). The highest dry matter content (18.53%) and viscosity (24 cp) were observed in treatment 4 [100% sucrose (7 g/100 g), 50% stevia (0.012 g/100 g), and inulin (0.03 g/100 g)] (Table 2).
Table 2.
Effects of Different Formulations on Physicochemical Characteristics of Chocolate Milk
|
Treatment No.
|
Energy (kcal/g)
|
Total sugar (%)
|
Protein (%)
|
Fat (%)
|
Viscosity (cp)
|
Density (g/cm3)
|
Dry matter (%)
|
Acidity (°D)
|
pH
|
| 1 |
68.94 ± 0.17 |
10.78 ± 0.01 |
3.08 ± 0.010 |
1.50 ± 0.001 |
20.9 ± 2.0 |
1.051 ± 0.001 |
13.01 ± 0.00 |
15 ± 0.020 |
6.61 ± 0.001 |
| 2 |
60.02 ± 0.18 |
8.52 ± 0.04 |
3.10 ± 0.008 |
1.50 ± 0.008 |
20.0 ± 1.1 |
1.055 ± 0.008 |
15.23 ± 0.11 |
15 ± 0.002 |
6.61 ± 0.003 |
| 3 |
69.83 ± 0.06 |
10.9 ± 0.02 |
3.07 ± 0.003 |
1.50 ± 0.002 |
20.0 ± 2.7 |
1.052 ± 0.002 |
13.03 ± 0.31 |
15.5 ± 0.001 |
6.62 ± 0.001 |
| 4 |
76.50 ± 0.09 |
12.7 ± 0.01 |
3.05 ± 0.004 |
1.50 ± 0.004 |
24.0 ± 0.3 |
1.058 ± 0.004 |
18.53 ± 0.03 |
15 ± 0.008 |
6.65 ± 0.002 |
| 5 |
53.98 ± 0.00 |
7.02 ± 0.03 |
3.10 ± 0.001 |
1.50 ± 0.001 |
21.0 ± 0.2 |
1.050 ± 0.001 |
11.63 ± 0.00 |
16.5 ± 0.003 |
6.58 ± 0.003 |
| 6 |
6138 ± 0.33 |
8.89 ± 0.05 |
3.08 ± 0.003 |
1.50 ± 0.003 |
22.2 ± 0.3 |
1.056 ± 0.003 |
15.30 ± 0.00 |
15 ± 0.005 |
6.65 ± 0.002 |
| 7 |
76.63 ± 0.09 |
12.6 ± 0.01 |
3.07 ± 0.004 |
1.55 ± 0.001 |
21.7 ± 0.8 |
1.053 ± 0.001 |
17.03 ± 0.01 |
15 ± 0.002 |
6.70 ± 0.003 |
| 8 |
61.90 ± 0.006 |
9.00 ± 0.04 |
3.10 ± 0.030 |
1.50 ± 0.004 |
22.0 ± 0.1 |
1.059 ± 0.004 |
15.39 ± 0.33 |
15.5 ± 0.002 |
6.65 ± 0.005 |
| 9 |
76.67 ± 0.17 |
12.6 ± 0.02 |
3.08 ± 0.040 |
1.55 ± 0.005 |
21.2 ± 0.2 |
1.052 ± 0.005 |
17.17 ± 0.01 |
15 ± 0.004 |
6.68 ± 0.004 |
| 10 |
73.46 ± 0.008 |
11.90 ± 0.01 |
3.09 ± 0.003 |
1.50 ± 0.003 |
20.3 ± 0.0 |
1.053 ± 0.003 |
15.39 ± 0.01 |
15 ± 0.001 |
6.69 ± 0.004 |
| 11 |
73.50 ± 0.003 |
11.90 ± 0.03 |
3.10 ± 0.001 |
1.50 ± 0.001 |
20.9 ± 0.0 |
1.060 ± 0.001 |
16.98 ± 0.23 |
15.5 ± 0.003 |
6.63 ± 0.007 |
| 12 |
66.22 ± 0.007 |
10.08 ± 0.04 |
3.10 ± 0.005 |
1.50 ± 0.002 |
22.1 ± 0.8 |
1.058 ± 0.002 |
13.12 ± 0.01 |
15 ± 0.008 |
6.67 ± 0.001 |
| 13 |
70.63 ± 0.033 |
11.08 ± 0.01 |
3.09 ± 0.007 |
1.55 ± 0.001 |
21.0 ± 0.1 |
1.055 ± 0.001 |
15.19 ± 0.00 |
15 ± 0.011 |
6.68 ± 0.003 |
| 14 |
70.02 ± 0.004 |
11.05 ± 0.02 |
3.08 ± 0.003 |
1.50 ± 0.003 |
22.8 ± 0.5 |
1.050 ± 0.003 |
15.39 ± 0.01 |
15 ± 0.004 |
6.63 ± 0.002 |
| 15 |
73.46 ± 0.001 |
11.90 ± 0.01 |
3.09 ± 0.002 |
1.50 ± 0.005 |
21.0 ± 0.0 |
1.052 ± 0.001 |
15.29 ± 0.00 |
15.5 ± 0.010 |
6.63 ± 0.003 |
| 16 |
70.18 ± 0.003 |
11.07 ± 0.04 |
3.10 ± 0.008 |
1.50 ± 0.002 |
18.7 ± 0.9 |
1.055 ± 0.002 |
13.2 ± 0.25 |
15.5 ± 0.002 |
6.64 ± 0.001 |
| 17 |
61.74 ± 0.004 |
8.96 ± 0.03 |
3.10 ± 0.001 |
1.50 ± 0.001 |
20.9 ± 0.0 |
1.056 ± 0.001 |
15.35 ± 0.00 |
15.5 ± 0.330 |
6.65 ± 0.002 |
| 18 |
73.58 ± 0.003 |
11.92 ± 0.01 |
3.10 ± 0.004 |
1.50 ± 0.004 |
21.3 ± 0.0 |
1.052 ± 0.004 |
17.11 ± 0.00 |
15.5 ± 0.033 |
6.67 ± 0.003 |
| 19 |
74.30 ± 0.002 |
12.10 ± 0.02 |
3.10 ± 0.002 |
1.50 ± 0.002 |
22.8 ± 0.0 |
1.052 ± 0.002 |
18.52 ± 0.14 |
15.5 ± 0.010 |
6.60 ± 0.003 |
Data are presented as mean ± SD.
Only minor variations were observed in the fat (between 1.50% and 1.55%) and protein levels (between 3.05% and 3.10%) (Table 2). There were significant differences between the samples in terms of total sugar (P < 0.05). In addition, there were significant differences between the formulations in terms of the energy level (P < 0.05). The results showed that treatment 5 had the lowest total sugar (7.02%) and energy level (53.98%).
The sensory scores for taste, texture, and overall acceptability of the samples are presented in Table 3. Formulation 2 [50% sucrose (3.5 g/100 g), 50% stevia (0.012 g/100 g), and inulin (0.03 g/100 g)] and formulation 13 [50% sucrose (3.5 g/100 g), 50% stevia (0.012 g/100 g), and inulin (0 g/100 g)] had the highest scores for taste and overall acceptability, while the lowest sensory scores belonged to the formulation containing no sucrose (treatment 5). The results obtained from ANOVA are presented in Table 4.
Table 3.
Effect of Various Concentrations of Sucrose, Stevia, and Inulin on the Score of Taste, Texture and Overall Acceptability
|
Treatment No.
|
Overall Acceptability
|
Texture
|
Taste
|
| 1 |
3.25 |
4.125 |
3.5 |
| 2 |
4.375 |
4.875 |
4.625 |
| 3 |
2.875 |
4 |
2.75 |
| 4 |
4.125 |
4.375 |
4.125 |
| 5 |
2.25 |
4 |
2 |
| 6 |
4.5 |
4.75 |
4.75 |
| 7 |
4.125 |
4.5 |
4 |
| 8 |
4.25 |
4.625 |
4.25 |
| 9 |
4.375 |
4.75 |
4.25 |
| 10 |
3.875 |
4.375 |
3.375 |
| 11 |
4 |
4.5 |
4.125 |
| 12 |
4.5 |
4.625 |
4.375 |
| 13 |
4.375 |
4.5 |
4.625 |
| 14 |
4.25 |
4.875 |
4.25 |
| 15 |
3.875 |
4.5 |
3.75 |
| 16 |
4.5 |
4.5 |
4.375 |
| 17 |
3.625 |
4.375 |
3.375 |
| 18 |
2.75 |
4.125 |
2.75 |
Table 4.
Analysis of Variance for the Response Surface Models in Terms of Coded Units
|
Response
|
Source
|
DF
|
Sum of square
|
Mean Square
|
F value
|
P
value
|
R2adj
|
| pH |
X1* |
1 |
4.49 |
4.49 |
5.91 |
0.029 |
0.321 |
| X2* |
1 |
3.45 |
3.45 |
4.54 |
0.051 |
| X3* |
1 |
4.50 |
4.50 |
0.59 |
0.450 |
| Model |
3 |
8.40 |
2.80 |
3.68 |
0.038 |
| Lack of fit |
14 |
0.01 |
7.60 |
- |
- |
| Pure error |
3 |
1.20 |
4.00 |
- |
- |
| Total |
17 |
0.01 |
- |
- |
- |
| Acidity |
X1 |
1 |
0.91 |
0.91 |
7.64 |
0.015 |
0.303 |
| X2 |
1 |
0.25 |
0.25 |
2.09 |
0.170 |
| X3 |
1 |
0.08 |
0.08 |
0.67 |
0.426 |
| Model |
3 |
1.24 |
0.41 |
3.46 |
0.045 |
| Lack of fit |
14 |
1.67 |
0.12 |
- |
- |
| Pure error |
3 |
0.19 |
0.06 |
- |
- |
| Total |
17 |
2.90 |
- |
- |
- |
| Dry matter |
X1 |
1 |
55.55 |
55.55 |
2371.39 |
0.000 |
0.992 |
| X2 |
1 |
3.93 |
3.93 |
0.17 |
0.688 |
| X3 |
1 |
0.01 |
0.01 |
0.49 |
0.494 |
| Model |
3 |
55.57 |
18.52 |
790.68 |
0.000 |
| Lack of fit |
14 |
0.33 |
0.023 |
- |
- |
| Pure error |
3 |
0.01 |
4.75 |
- |
- |
| Total |
17 |
55.90 |
- |
- |
- |
| Density |
X1 |
1 |
1.32 |
1.32 |
1.28 |
0.276 |
0.084 |
| X2 |
1 |
3.97 |
3.97 |
0.38 |
0.545 |
| X3 |
1 |
8.00 |
8.00 |
7.752 |
0.931 |
| Model |
3 |
1.73 |
5.76 |
0.56 |
0.65 |
| Lack of fit |
14 |
1.445 |
1.032 |
- |
- |
| Pure error |
3 |
9.00 |
3.00 |
- |
- |
| Total |
17 |
1.61 |
- |
- |
- |
| Viscosity |
X1 |
1 |
2.60 |
2.60 |
3.28 |
0.145 |
0.180 |
| X2 |
1 |
7.62 |
6.62 |
0.17 |
0.688 |
| X3 |
1 |
4.03 |
4.03 |
3.68 |
0.075 |
| Model |
3 |
7.40 |
2.46 |
2.25 |
0.127 |
| Lack of fit |
14 |
1.53 |
0.096 |
- |
- |
| Pure error |
3 |
2.75 |
9.16 |
- |
- |
| Total |
17 |
2.27 |
- |
- |
- |
| Fat |
X1 |
1 |
8.51 |
8.51 |
0.22 |
0.649 |
0.147 |
| X2 |
1 |
1.39 |
1.39 |
0.35 |
0.561 |
| X3 |
1 |
9.80 |
9.80 |
0.25 |
0.625 |
| Model |
3 |
3.22 |
1.07 |
0.27 |
0.844 |
| Lack of fit |
14 |
5.52 |
3.94 |
- |
- |
| Pure error |
3 |
1.67 |
5.58 |
- |
- |
| Total |
17 |
5.84 |
- |
- |
- |
| Protein |
X1 |
1 |
5.17 |
5.17 |
2.47 |
0.138 |
0.017 |
| X2 |
1 |
2.07 |
2.07 |
0.09 |
0.758 |
| X3 |
1 |
3.20 |
3.20 |
0.15 |
0.702 |
| Model |
3 |
5.70 |
1.90 |
0.91 |
0.463 |
| Lack of fit |
14 |
2.94 |
2.10 |
- |
- |
| Pure error |
3 |
3.00 |
1.00 |
- |
- |
| Total |
17 |
3.51 |
- |
- |
- |
| Total sugar |
X1 |
1 |
18.54 |
18.54 |
9.75 |
0.007 |
0.293 |
| X2 |
1 |
0.32 |
0.32 |
0.17 |
0.688 |
| X3 |
1 |
0.29 |
0.29 |
0.15 |
0.701 |
| Model |
3 |
19.15 |
6.38 |
3.36 |
0.049 |
| Lack of fit |
14 |
26.62 |
1.90 |
- |
- |
| Pure error |
3 |
0.14 |
0.04 |
- |
- |
| Total |
17 |
45.77 |
- |
- |
- |
| Energy |
X1 |
1 |
290.69 |
290.69 |
9.81 |
0.007 |
0.269 |
| X2 |
1 |
5.69 |
5.69 |
0.19 |
0.667 |
| X3 |
1 |
4.39 |
4.39 |
0.15 |
0.706 |
| Model |
3 |
300.77 |
100.26 |
3.38 |
0.048 |
| Lack of fit |
14 |
414.90 |
29.64 |
- |
- |
| Pure error |
3 |
2.31 |
0.77 |
- |
- |
| Total |
17 |
715.67 |
- |
- |
- |
| Taste |
X1 |
1 |
3.61 |
3.61 |
12.26 |
0.003 |
0.480 |
| X2 |
1 |
1.88 |
1.88 |
6.37 |
0.024 |
| X3 |
1 |
0.03 |
0.03 |
0.11 |
0.700 |
| Model |
3 |
5.52 |
1.84 |
6.25 |
0.006 |
| Lack of fit |
14 |
4.12 |
0.29 |
- |
- |
| Pure error |
3 |
0.70 |
0.23 |
- |
- |
| Total |
17 |
9.64 |
- |
- |
- |
| Texture |
X1 |
1 |
0.45 |
0.45 |
10.75 |
0.005 |
0.434 |
| X2 |
1 |
0.22 |
0.22 |
5.21 |
0.038 |
| X3 |
1 |
3.41 |
3.41 |
0.08 |
0.778 |
| Model |
3 |
0.66 |
0.22 |
5.35 |
0.011 |
| Lack of fit |
14 |
0.58 |
0.04 |
- |
- |
| Pure error |
3 |
0.07 |
0.02 |
- |
- |
| Total |
17 |
1.24 |
- |
- |
- |
| Overall acceptability |
X1 |
1 |
2.66 |
2.66 |
9.71 |
0.007 |
0.396 |
| X2 |
1 |
0.97 |
0.97 |
3.55 |
0.080 |
| X3 |
1 |
0.25 |
0.25 |
0.90 |
0.359 |
| Model |
3 |
3.87 |
1.29 |
4.72 |
0.017 |
| Lack of fit |
14 |
3.83 |
0.27 |
- |
- |
| Pure error |
3 |
0.53 |
0.18 |
- |
- |
| Total |
17 |
7.70 |
- |
- |
- |
*Sucrose (X1) (0, 20.27, 50, 79.73, and 100%), stevia (X2) (0, 20.27, 50, 79.73, and 100%), and inulin (X3) (0, 0.01, 0.03, 0.05, and 0.06)
The effect of sucrose (X1) and stevia (X2) on the sensory quality of chocolate milk is represented in Figures 1 and 2 using response surface plots. Figures clearly show that increasing the concentration of sucrose and stevia affected the quality of the chocolate milk, and the highest scores were obtained for taste (Figure 1) and texture (Figure 2).
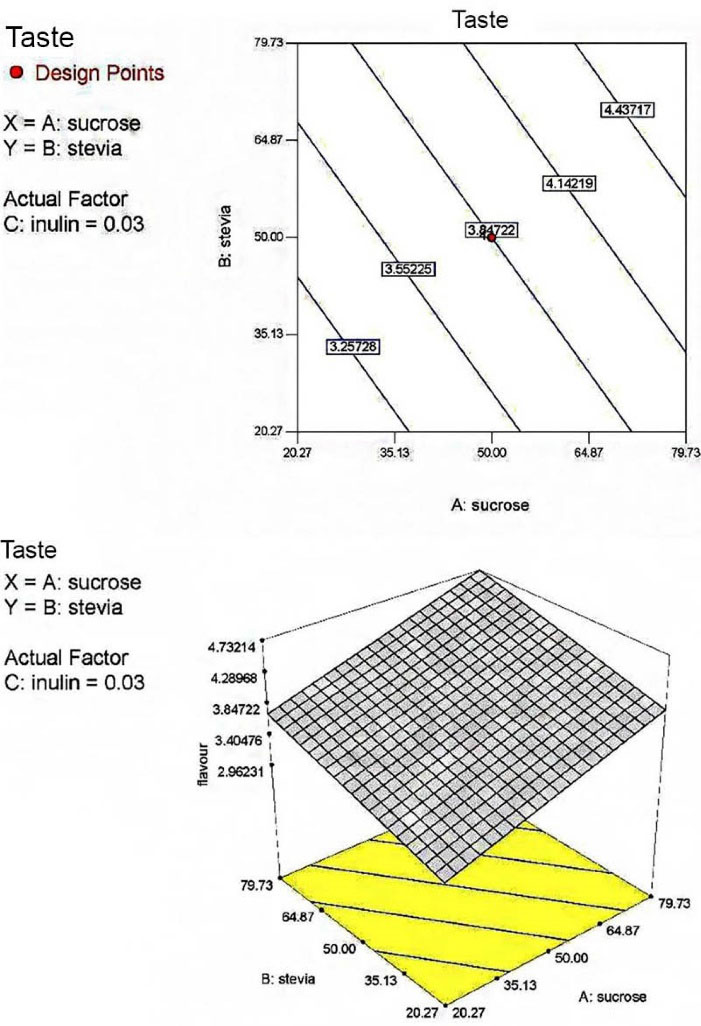
Figure 1.
Response Surface Plot of the Effects of Stevia and Sucrose on the Taste of Chocolate Milk
.
Response Surface Plot of the Effects of Stevia and Sucrose on the Taste of Chocolate Milk
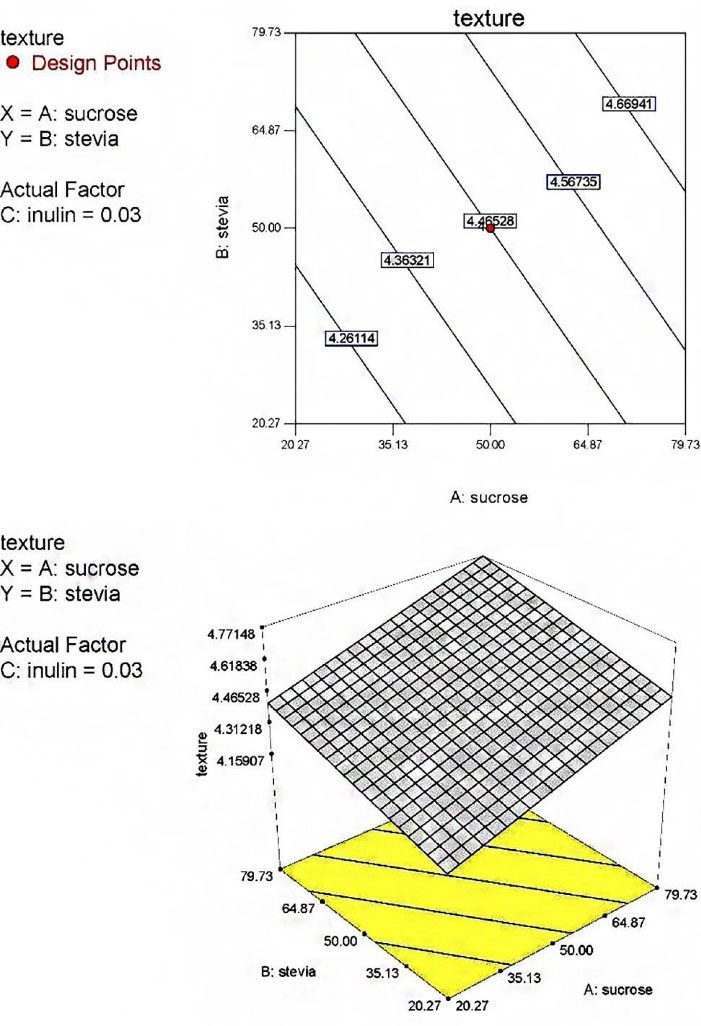
Figure 2.
Response Surface Plot of the Effects of Stevia and Sucrose on the Texture of Chocolate Milk
.
Response Surface Plot of the Effects of Stevia and Sucrose on the Texture of Chocolate Milk
To determine the optimum formulation, sensory scores were analyzed using Design Expert software version 6.0.2. Results showed that formulation 12 [20.27% sucrose (1.4 g/100 g), 79.73% stevia (0.018 g/100 g), and inulin (0.01 g/100 g)] and formulation 16 [20.27% sucrose (1.4 g/100 g), 79.73% stevia (0.018 g/100 g), and inulin (0.02 g/100 g)] had the highest acceptability among the examined formulations. The most optimized formulation was obtained using 20.27% sucrose (1.4 g/100 g), 79.73% stevia (0.018 g/100 g), and inulin (0.02 g/100 g).
Discussion
Based on the results of this study, the most optimized formulation was obtained using 20.27% sucrose (1.4 g/100 g), 79.73% (0.018 g/100 g) stevia, and inulin (0.02 g/100 g). The results of this study showed a significant difference in the mean pH of different treatments (P < 0.05). It was found that the pH of samples decreased with the reduction of sucrose content. Moreover, by the complete removal of sucrose from the formulation, the acidity level of samples was increased. Hence, treatment 5 [50% stevia (0.012 g/100 g), 0% sucrose, and inulin (0.03 g/100 g)] had the highest titratable acidity (16.5 °D). In a study performed by Alizadeh et al12 on the substitution of sucrose with stevia, no remarkable effect on the pH value and acidity of fruit-based milkshake was found. However, in accordance with the result of the present study, it has been reported that the pH of saffron syrup decreased with the increase of the concentration of stevia.16
Saniah and Samsiah13 reported that sucrose is the major contributor to total soluble solid content of carbonated drinks, whereas steviahas a negative effect on this parameter. Furthermore, the increased concentration of sucrose led to an increase in the viscosity of the syrup as well as the carbonated drink. It was also demonstrated that the total solid content decreased in proportion to the reduction in the sucrose content of the milk shake.12 Similar findings were obtained in the present study. Treatment 4 [100% sucrose (7 g/100 g), 50% Stevia (0.012 g/100 g), and inulin (0.03 g/100 g)] and control sample [100% sucrose (7 g/100g), 0% stevia, and inulin (0 g/100 g)] had the highest dry matter content (18.53% and 18.52%, respectively), while treatment 5 [0% sucrose, 50% stevia (0.012 g/100 g), and inulin (0.03 g/100 g)] had the lowest dry matter content (11.63%). Besides, the viscosity increased in samples with high sucrose content. The amount of sucrose added may affect the acceptability of the product, particularly for viscosity.13 It has been shown that sugar in beverages not only contributes to the sweetness but also adds body and mouthfeel.13
The combination of sucrose and steviain the formulation of chocolate milk did not have a considerable effect on the fat and protein levels, while total sugar content reduced from 12.7% in the control sample to 7% (treatment 5). Stevia and inulin concentrations did not have a significant effect on total sugar content. Additionally, the substitution of sucrose with stevia decreased the energy level from 73.4 Kcal/g (control) to 53 Kcal/g (treatment 5), and the energy of samples was reduced by decreasing the concentration of sucrose. In a similar study, Saniah and Samsiah found that decreasing the sucrose concentration and increasing the stevia concentration decreased the total sugar content of the carbonated drinks.13 Furthermore, sucrose-steviabased samples provided significantly lower calorie (32 kcal/100 mL) than the control sample (56 kcal/100 mL).
The evaluation of sensory properties of samples by panelists indicated that formulation 2 [50% sucrose (3.5 g/100 g), 50% stevia (0.012 g/100 g), and inulin (0.03 g/100 g)], formulation 9 [79.73% sucrose (5.6 g/100 g), 79.73% stevia (0.018 g/100 g), and inulin (0.05 g/100 g)] and formulation 13 [50% sucrose (3.5 g/100 g), 50% stevia (0.012 g/100 g), and inulin (0 g/100 g)] had the highest score for overall acceptability. These results are in line with another study which reported that the low-calorie jam can be produced using stevioside by reducing the sugar content to 50% without any changes in its sensory quality.17
In the present study, the formulation with 0% of sucrose (treatment 5) had the lowest score for taste, texture, and overall acceptability. Although steviacan be completely used for sweetness, its bitter taste should be masked in the product.18 Rebaudioside A, a component of stevia, is known to have a bitter taste when used at higher levels and it can reduce the acceptability of the product. In addition, it has been reported that increasing the concentration of rebaudioside A may lead to a decrease in the hardness and consistency of yogurt.4,19 Saniah and Samsiah13 suggested that different concentrations of sucrose can significantly affect the bitter taste of stevia and the addition of sucrose can improve the sensory quality of the product in terms of taste and texture
In order to visualize the relationship between variables and responses, a three-dimensional response surface plot was used in this study. Using this method in the optimization process, treatment 12 [20.27% sucrose (1.4 g/100 g), 79.73% stevia (0.018 g/100g), and inulin (0.01 g/100 g)] and treatment 16 [20.27% sucrose (1.4 g/100 g), 79.73% stevia (0.018 g/100 g), and inulin (0.05 g/100 g)] were the best formulations in terms of taste, texture, and overall acceptability. The most optimized formulation was also obtained when 20.27% sucrose (1.4 g/100 g) was used in combination with 79.73% stevia (0.018 g/100 g) and inulin (0.02 g/100 g). Alizadeh et al reported that the combination of sucrose and steviaused at the ratio of 25:75 in fruit-based milk shake had the most acceptable quality according to the panelists.12 However, 0.25% stevia in fermented dairy products has been suggested as the most acceptable concentration.20 Lisak et al2 also reported that strawberry-flavored fresh yogurt sweetened with a combination of sucrose and steviaat 4.5% concentration was the most preferred formulation. It has been noted that the acceptability level of steviadepends on food products. Because overall sensory properties of beverages may be affected by some parameters such as possible interactions of added sweeteners with the sweetening components of food12, synergistic or inhibitory effects of various sweeteners, temperature, and viscosity of food as well as the properties of dispersion media.21
Conclusion
Results showed that steviacan partially be used as a substitute for sucrose without a significant effect on physicochemical characteristics and sensory properties of chocolate milk. In the present study, treatment 12 [20.27 sucrose (1.4 g/100 g), 79.73% stevia (0.018 g/100 g), and inulin (0.01 g/100 g)] and treatment 16 [20.27 sucrose (1.4 g/100 g), 79.73% stevia (0.4 g/100 g), and inulin (0.05 g/100 g)] were the optimum formulations.
However, further research in this field is needed to study the use of other concentrations of stevia in chocolate milk as well as the replacement of artificial sweeteners and sugar with stevia in other high-calorie beverages and foods.
Ethics statement
Not applicable.
Disclosure of funding source
No specific grant was received for this research from any funding agency.
Conflict of interests declaration
Authors declare no competing interests.
Acknowledgments
The authors would like to appreciate Tabriz University of Medical Sciences for their support.
Consent for publication
Not applicable.
References
- Shankar P, Ahuja S, Sriram K. Non-nutritive sweeteners: review and update. Nutrition 2013; 29(11-12):1293-9. doi: 10.1016/j.nut.2013.03.024 [Crossref] [ Google Scholar]
- Lisak K, Lenc M, Jeličić I, Božanić R. Sensory evaluation of the strawberry flavored yoghurt with stevia and sucrose addition. Croatian Journal of Food Technology, Biotechnology and Nutrition 2012; 7:39-43. [ Google Scholar]
- Vilela A, Matos S, Abraão AS, Lemos AM, Nunes FM. Sucrose replacement by sweeteners in strawberry, raspberry, and cherry Jams: effect on the textural characteristics and sensorial profile—a chemometric approach. J Food Process 2015; 2015:749740. doi: 10.1155/2015/749740 [Crossref] [ Google Scholar]
- Guggisberg D, Piccinali P, Schreier K. Effects of sugar substitution with Stevia, ActilightTM and Stevia combinations or PalatinoseTM on rheological and sensory characteristics of low-fat and whole milk set yoghurt. Int Dairy J 2011; 21(9):636-44. doi: 10.1016/j.idairyj.2011.03.010 [Crossref] [ Google Scholar]
- Zygler A, Wasik A, Kot-Wasik A, Namieśnik J. Determination of nine high-intensity sweeteners in various foods by high-performance liquid chromatography with mass spectrometric detection. Anal Bioanal Chem 2011; 400(7):2159-72. doi: 10.1007/s00216-011-4937-z [Crossref] [ Google Scholar]
- Clos JF, DuBois GE, Prakash I. Photostability of rebaudioside A and stevioside in beverages. J Agric Food Chem 2008; 56(18):8507-13. doi: 10.1021/jf801343e [Crossref] [ Google Scholar]
- Geuns JM. Stevioside. Phytochemistry 2003; 64(5):913-21. doi: 10.1016/s0031-9422(03)00426-6 [Crossref] [ Google Scholar]
- Gardana C, Simonetti P, Canzi E, Zanchi R, Pietta P. Metabolism of stevioside and rebaudioside A from Stevia rebaudiana extracts by human microflora. J Agric Food Chem 2003; 51(22):6618-22. doi: 10.1021/jf0303619 [Crossref] [ Google Scholar]
- Nunes AP, Ferreira-Machado SC, Nunes RM, Dantas FJ, De Mattos JC, Caldeira-de-Araújo A. Analysis of genotoxic potentiality of stevioside by comet assay. Food Chem Toxicol 2007; 45(4):662-6. doi: 10.1016/j.fct.2006.10.015 [Crossref] [ Google Scholar]
- Carakostas MC, Curry LL, Boileau AC, Brusick DJ. Overview: the history, technical function and safety of rebaudioside A, a naturally occurring steviol glycoside, for use in food and beverages. Food Chem Toxicol 2008; 46 Suppl 7:S1-S10. doi: 10.1016/j.fct.2008.05.003 [Crossref] [ Google Scholar]
- Shah AB, Jones GP, Vasiljevic T. Sucrose‐free chocolate sweetened with Stevia rebaudiana extract and containing different bulking agents–effects on physicochemical and sensory properties. Int J Food Sci Technol 2010; 45(7):1426-35. doi: 10.1111/j.1365-2621.2010.02283.x [Crossref] [ Google Scholar]
- Alizadeh M, Azizi-lalabadi M, Hojat-Ansari H, Kheirouri S. Effect of Stevia as a substitute for sugar on physicochemical and sensory properties of fruit based milk shake. J Sci Res Rep 2014; 3(11):1421-9. [ Google Scholar]
- Saniah K, Samsiah MS. The application of Stevia as sugar substitute in carbonated drinks using response surface methodology. J Trop Agric Food Sci 2012; 40(1):23-34. [ Google Scholar]
- Helrich K. Official Methods of Analysis of the Association of Official Analytical Chemists. Association of Official Analytical Chemists; 1990.
- Lane JH, Eynon L. Determination of Reducing Sugars by Fehling’s Solution with Methylene Blue Indicator. London: Norman Rodger; 1934.
- Hashemi N, Rabiee H, Tavakolipour H, Gazerani S. Effect of stevia (Stevia rebaudiana) as a substitute for sugar on physicochemical, rheological and sensory properties of dietary saffron syrup. Saffron Agronomy and Technology 2015; 2(4):303-10. [ Google Scholar]
- Yousefi AM, Goli SA, Kadivar M. Optimization of low-calorie quince jam production with stevioside sweetener. J Food Res 2012;22(2):155-64. [Persian].
- Tan SL. Stevia: Satisfying Malaysia’s Sweet Tooth. 2009.
- Yang X, Lu Y, Hu G. Optimization of sweetener formulation in sugar-free yoghurt using response surface methodology. CyTA J Food 2014; 12(2):121-6. doi: 10.1080/19476337.2013.804123 [Crossref] [ Google Scholar]
- Agarwal V, Kochhar A, Sachdeva R. Sensory and nutritional evaluation of sweet milk products prepared using stevia powder for diabetics. Stud Ethno Med 2010; 4(1):9-13. doi: 10.1080/09735070.2010.11886357 [Crossref] [ Google Scholar]
- Weber A, Hekmat S. The effect of Stevia rebaudiana on the growth and survival of Lactobacillus rhamnosus GR-1 and sensory properties of probiotic yogurt. J Food Res 2013; 2(2):136-43. [ Google Scholar]